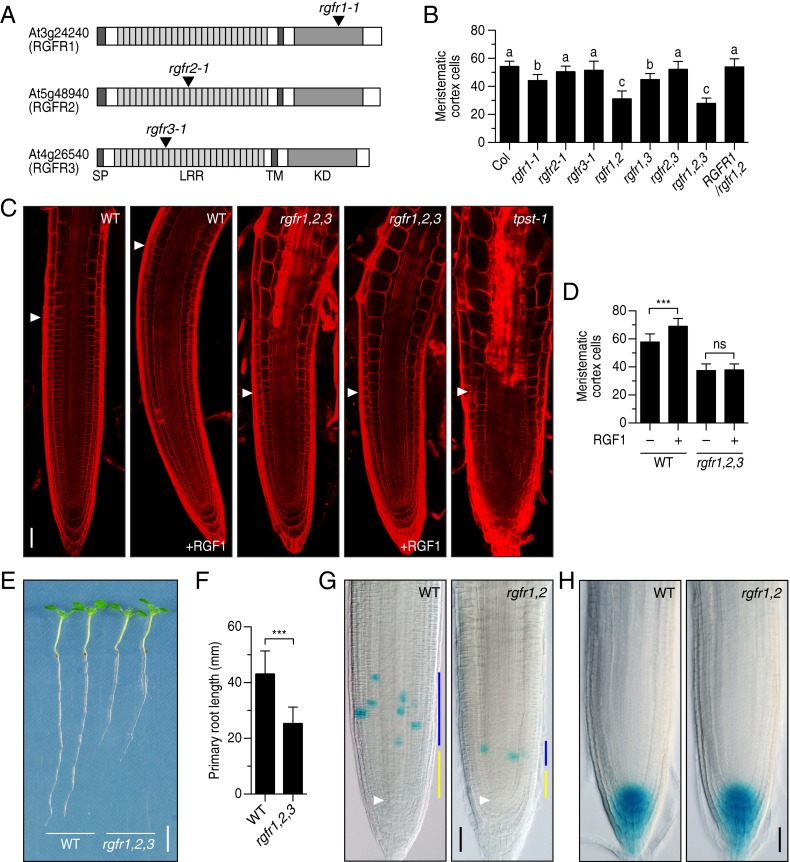
Fig. 3.
Phenotypic analysis of T-DNA insertion mutants of the RGFR genes. (A) Schematic representation of T-DNA insertion sites in rgfr1-1, rgfr2-1, and rgfr3-1. (B) Number of meristematic cortex cells in root meristem of wild-type, rgfr mutants, and complemented line at 5 DAG. Significant differences are indicated with different letters (n = 16–23; one-way ANOVA, see also Fig. S3B). (C) Confocal images of root meristem of wild-type and rgfr1-1 rgfr2-1 rgfr3-1 triple mutant treated with 100 nM RGF1 at 5 DAG. The root meristem of the tpst-1 mutant is also shown as a reference. (D) Quantitative analysis of the number of meristematic cortex cells in Fig. 3C (n = 16–35; ***P < 0.001; paired t test). (E) Root length of wild-type and rgfr1-1 rgfr2-1 rgfr3-1 triple mutant seedlings at 7 DAG. (F) Quantitative comparison of root length in Fig. 3E (n = 47–50; ***P < 0.001; paired t test). (G) CYCB1;1-GUS expression in wild type and rgfr1-1 rgfr2-1 root meristem at 5 DAG. Blue bar represents transit amplifying zone; yellow bar represents slow-dividing immature cell population zone that is thought to be a stem cell niche. White arrowheads indicate the quiescent center. (H) DR5:GUS expression in wild type and rgfr1-1 rgfr2-1 root meristems at 5 DAG. (Scale bar, C, G, and H, 50 μm; E, 5 mm.)

