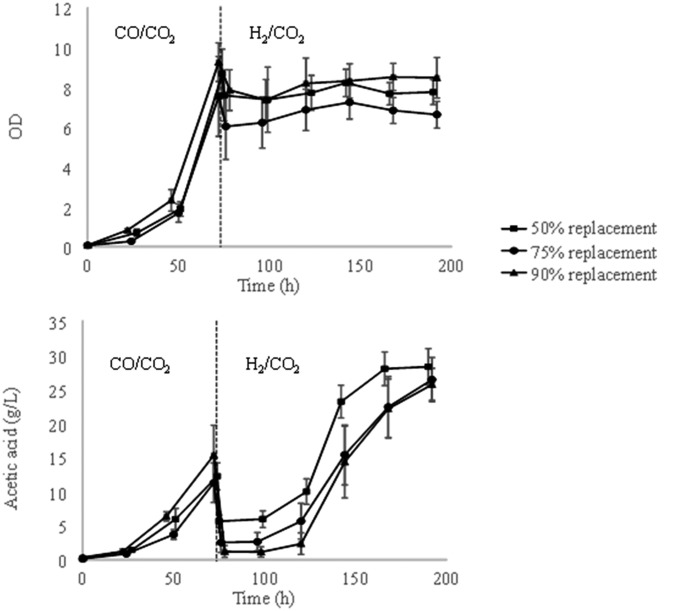
Fig. S1.
Time courses of acetic acid concentration and optical density for different media replacement ratios of switching the gas composition in the anaerobic bubble column. Three different media replacement ratios (50%, 75%, and 90%) were assessed. All runs showed similar patterns that the production resumed after about 1 d or 2 d delay and the production ended at the acetic acid concentration of about 25–30 g/L.

