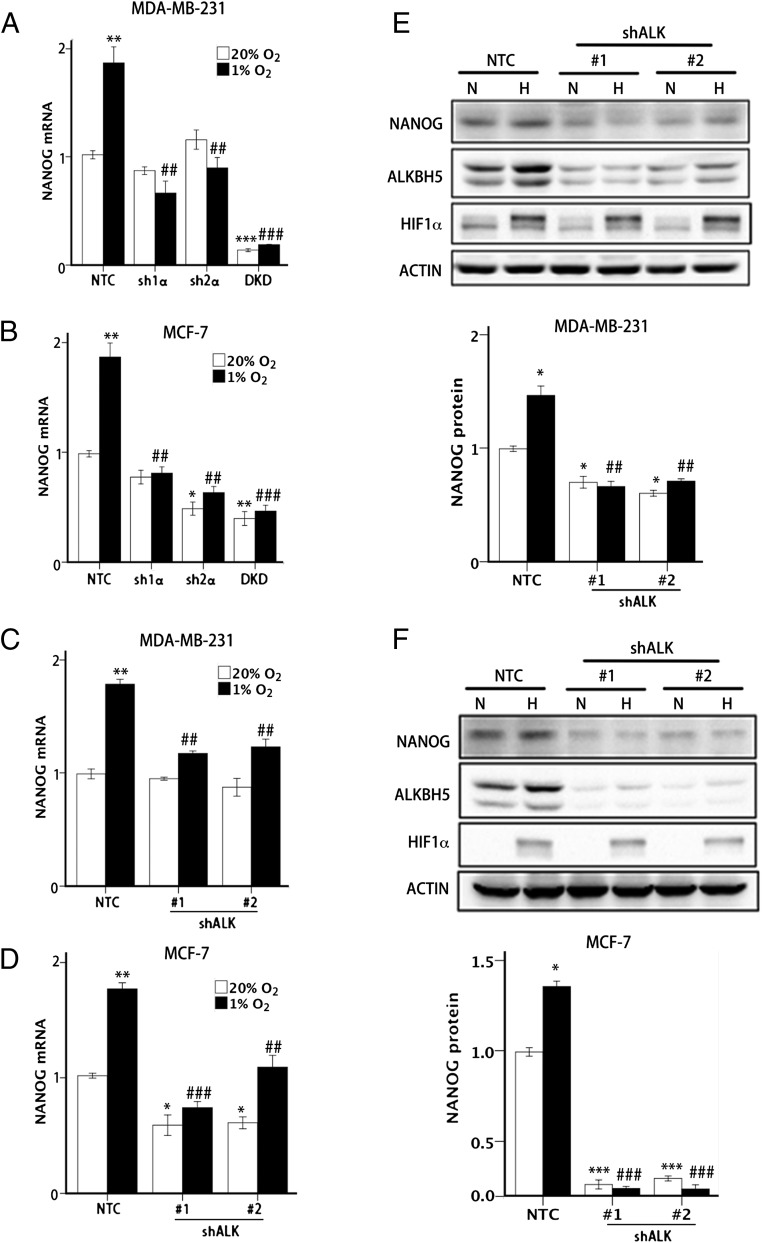
Fig. 2.
HIF and ALKBH5 are required for hypoxia-induced NANOG expression. (A and B) MDA-MB-231 (A) and MCF-7 (B) NTC and HIF knockdown subclones were exposed to 20% or 1% O2 for 24 h, and NANOG mRNA levels were determined by RT-qPCR. The results were normalized to NTC at 20% O2 (mean ± SEM; n = 3; *P < 0.05, **P < 0.01, and ***P < 0.001 vs. NTC at 20% O2; ##P < 0.01 and ###P < 0.001 vs. NTC at 1% O2). (C and D) MDA-MB-231 (C) and MCF-7 (D) NTC and shALK knockdown subclones were exposed to 20% or 1% O2 for 24 h, and NANOG mRNA levels were determined by RT-qPCR. The results were normalized to NTC at 20% O2 (mean ± SEM; n = 3; *P < 0.05 and **P < 0.01 vs. NTC at 20%; ##P < 0.01 and ###P < 0.001 vs. NTC at 1% O2). (E and F) MDA-MB-231 (E) and MCF-7 (F) NTC and shALK subclones were exposed to 20% or 1% O2 for 48 h, and immunoblot assays were performed to analyze HIF-1α, ALKBH5, and NANOG protein expression. Actin was analyzed as a loading control. NANOG band intensity was quantified and normalized to NTC at 20% O2 (mean ± SEM; n = 3; *P < 0.05 and ***P < 0.001 vs. NTC at 20% O2; ##P < 0.01 and ###P < 0.001 vs. NTC at 1% O2).

