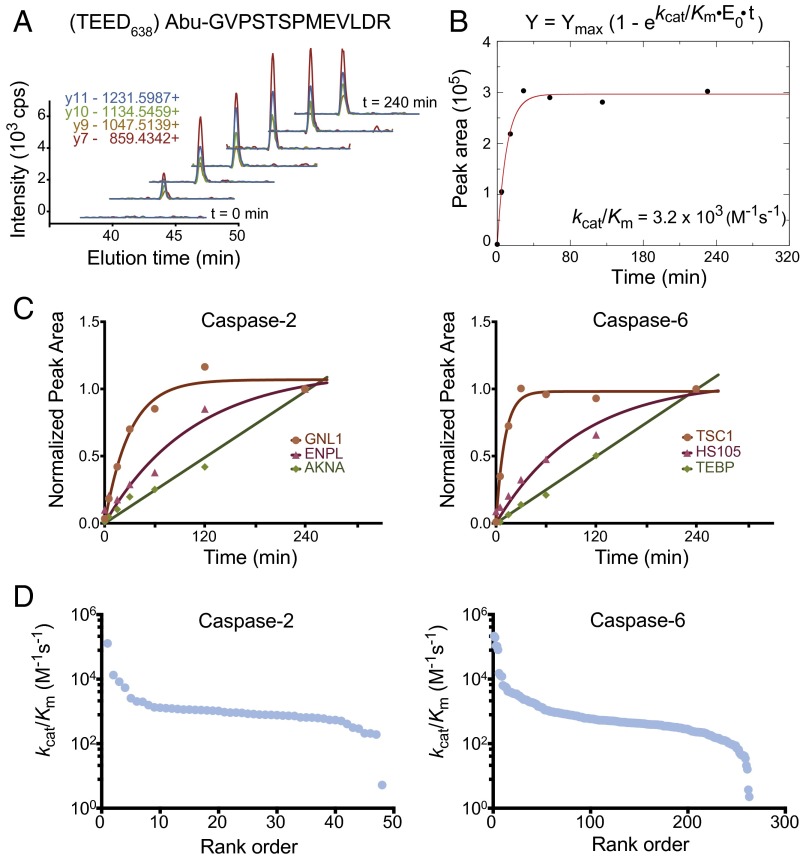
Fig. 3.
Determination of catalytic efficiency values (kcat/KM) for caspase-2 and caspase-6 substrates, using SRM. (A) Example chromatograms of the four transitions monitored for a peptide from the TSC1 protein shows accumulation of cleavage product over time. (B) The peak integrations were summed over the four transitions monitored to estimate extent of cleavage product and plotted as a function of time to determine the progress rate curve. (C) The assays were analyzed using pseudofirst-order kinetic conditions, and kcat/KM values were calculated as described in the Materials and Methods for 49 and 276 cleavage sites for caspase-2 and caspase-6, respectively. Three examples are shown for caspase-2 (Left) and caspase-6 (Right). (D) A wide range of kcat/KM values were observed over two to four logs for caspase-2 and caspase-6 substrates, respectively. The fastest protein substrates (105 M−1⋅s−1) can only be estimated because they saturated too rapidly. Most of the substrates are in the order of 103 M−1·s−1 and fit well because multiple points were obtained before saturation.

