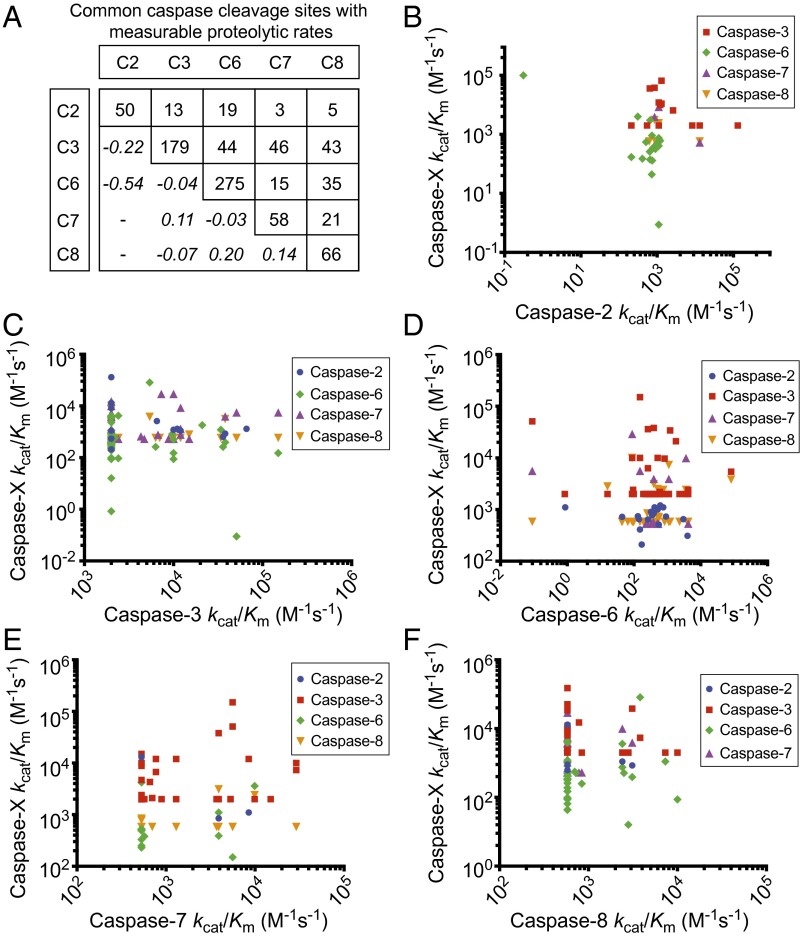
Fig. 4.
Pairwise comparisons of common substrates of caspase-2, caspase-3, caspase-6, caspase-7, and caspase-8 shows uncorrelated catalytic efficiency values. (A) Shows the number of common substrates with available rates of proteolysis determined among caspase-2, caspase-3, caspase-6, caspase-7, and caspase-8. (B–F) Shows the poor pairwise comparisons for the rate of proteolysis of the common substrates among the individual caspases. Pearson correlation coefficients are shown in italic in A (for n > 5). The vertical set of points for caspase-3, caspase-7, and caspase-8 (C, E, and F) reflect the lower limit of detection for slow substrates (10).

