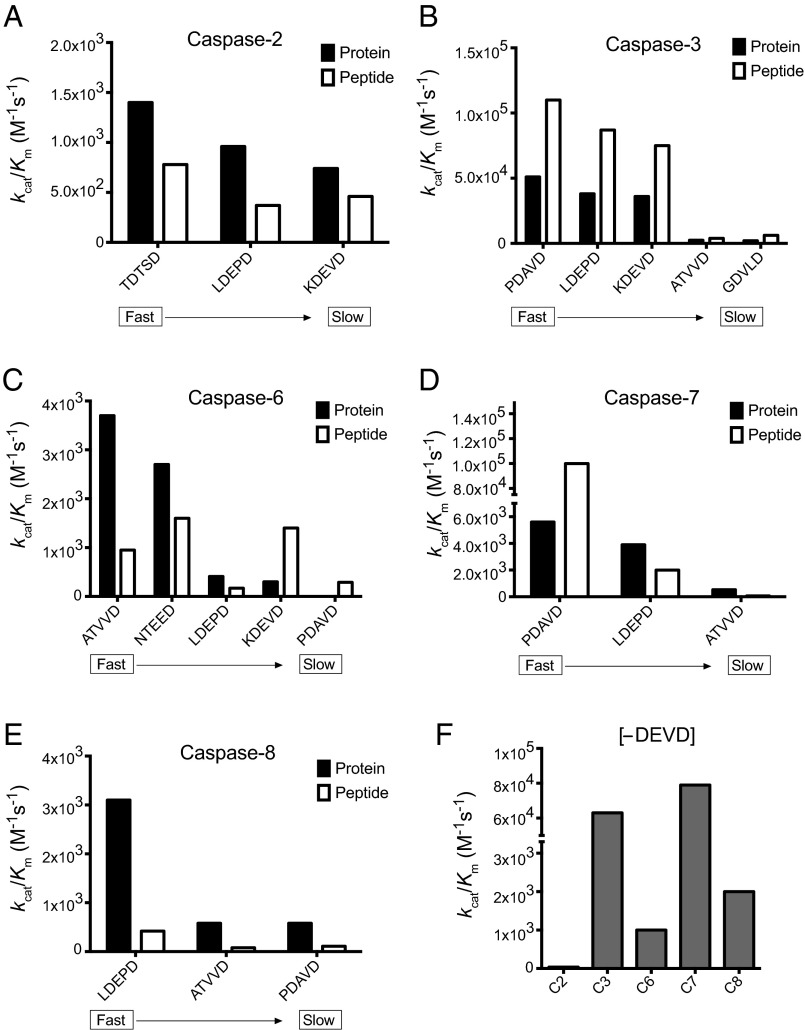
Fig. 6.
Rates of proteolysis for protein substrates compared with their corresponding peptide sequences. (A–E) Proteolysis rate constants for fast, medium, and slow substrates of caspase-2, caspase-3, caspase-6, caspase-7, and caspase-8, and corresponding tetradecapeptide sequences. P5-P1 residue sequences that match the corresponding protein cut sites are shown on the x-axis. (F) Cleavage rate constants for a DEVD↓GLGVAGGSRR peptide, lacking a P5 residue, highlighting the importance of this residue for caspase-2.

