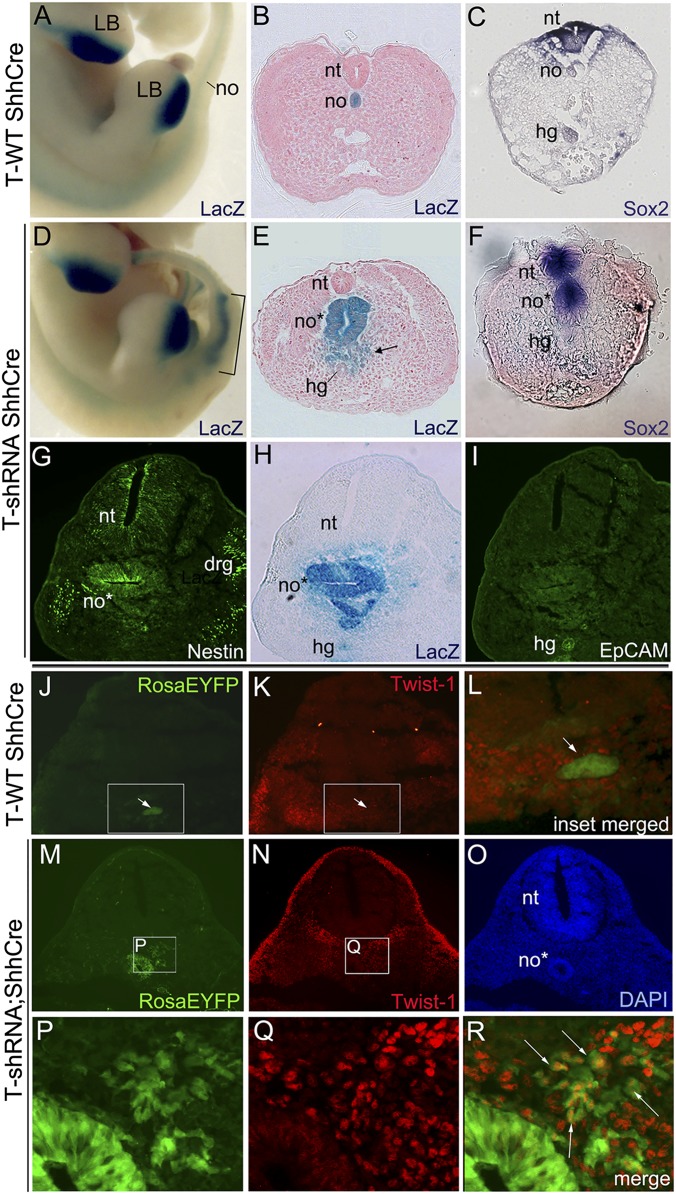
Fig. 4.
Notochord lineage tracing and fate analysis in E12 T-knockdown embryos. (A, B, D, and E) LacZ reporter activity in notochord lineage in T-shRNA;RosaLacZ;ShhCre and control RosaLacZ;ShhCre sibling embryos (A and D whole mount; B and E transverse tail sections). Notochord progenitors in T-knockdown embryos survive and expand (bracketed area in D) to form large epithelial tubular structures (E) as well as loose mesenchymal cells (arrow in E). In A and D normal limb bud LacZ activity (Shh-expressing) is also seen. (C, F, and G-I) Neural and gut endoderm marker analysis in T-knockdown embryos. (C and F) Early panneural marker Sox2 RNA is expressed in ectopic tubes of T-knockdown embryos as well as in neural tube compared with WT sibling control. (G–I) Immunofluorescence staining in T-knockdown for (G) panneural (Nestin) and (I) gut endoderm (EpCAM) markers compared with (H) LacZ reporter activity in serial sections. LacZ-positive ectopic tubular structures express neural but not hindgut marker. (J–R) Immunofluorescence for (K, N, and Q) the EMT marker Twist-1 (red) and (J, M, and P) visualization of notochord lineage cells (green) on the same section of T-shRNA;RosaEYFP;ShhCre or control RosaEYFP;ShhCre sibling embryos. Mesenchymal-appearing notochord lineage cells (arrows in R) are Twist-1–positive in T-knockdown embryos, whereas WT notochord (arrows in J–L) is Twist-1–negative. (L) Enlargement of merged image from boxed region in J and K. (P–R) Enlargements and merged image of boxed region in M and N. DAPI staining is shown in O. Note that background fluorescence from capillary endothelium is seen both within and around neural tube in M (confirmed by CD31 immunostaining). drg, dorsal root ganglia; hg, hindgut; LB, limb bud; no, notochord; no*, ectopic tubular structures; nt, neural tube.

