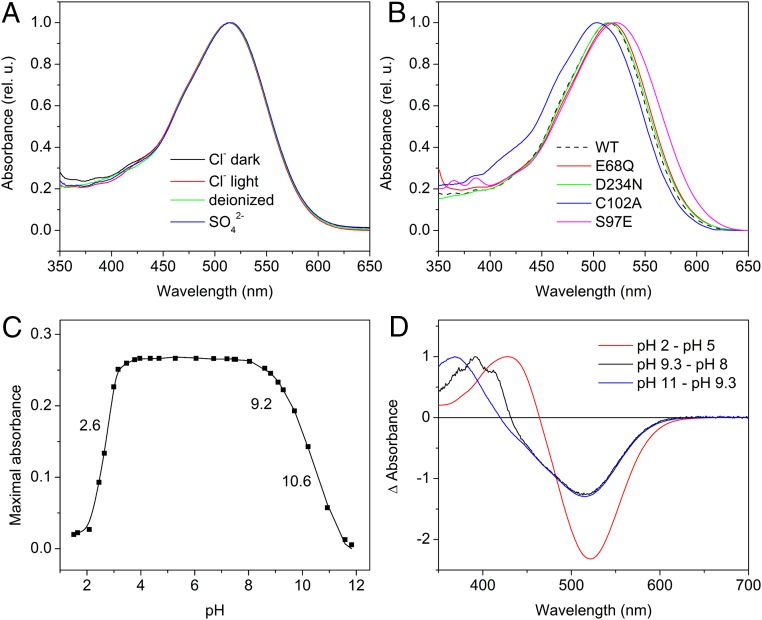
Fig. 1.
(A) Absorption spectra of GtACR1 detergent purified in buffer (pH 7.4) containing NaCl (black and red lines) or Na2SO4 (blue line), and a deionized sample (green line). The black and red lines show the spectra of the dark- and light-adapted samples, respectively. (B) Absorption spectra of the purified GtACR1_E68Q, D234N, C102A, and S97E mutants in NaCl buffer at pH 7.4. The WT spectrum from A is shown as a black dashed line for comparison. (C) The pH titration of the purified wild-type GtACR1 maximal absorbance of the ∼515-nm band. (D) The difference spectra obtained by subtraction of the absolute spectra as indicated.

