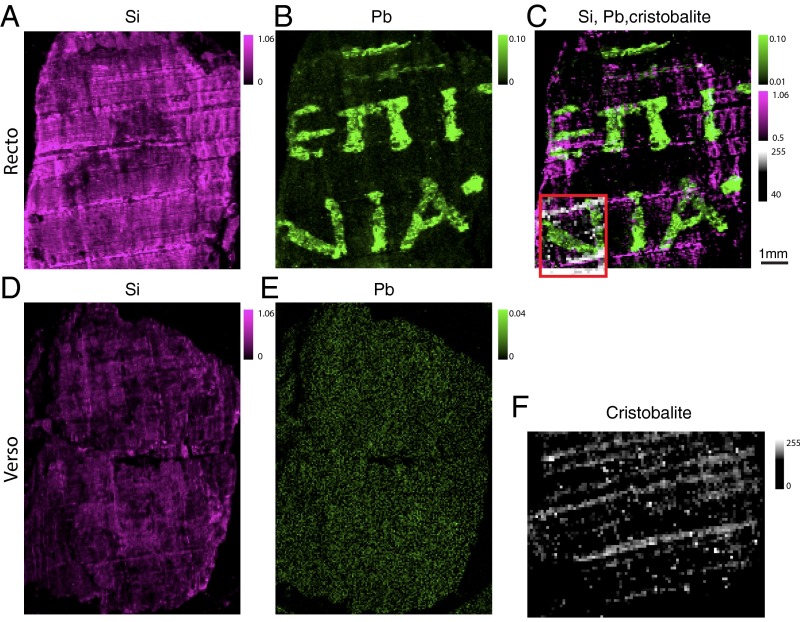
Fig. 3.
XRF and XRD maps obtained for the larger fragment. (A) Si XRF maps for the recto of the sample and (D) for its verso, (B and E) Pb XRF maps, (C) XRD cristobalite map superposed on the Pb XRF map, and (F) XRD cristobalite map on the portion of the sample defined by the red region of interest in C. The maps are normalized to the incident flux and are in arbitrary units.

