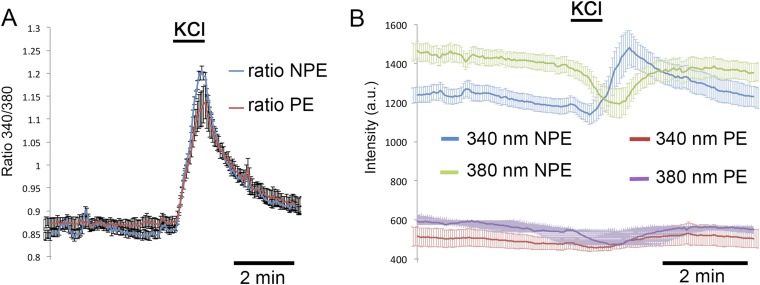
Fig. S4.
Dissociated CB cells. (A) Fluorescence 340/380 nm ratios and (B) emission intensities evoked by 340-, 380-nm excitation of Fura-2 in NPE and PE cells observed during high K stimulation (30 mM KCl). Although the absolute emission intensities are twice as strong in NPE cells (green and blue traces in B) compared to PE cells (red and purple traces in B), the 340/380 ratio magnitudes for NPE vs. PE cells (blue vs. red traces shown in A) are similar.

