
Fig 2. Protein oxidation in different experimental groups; values expressed as mean and SEM.
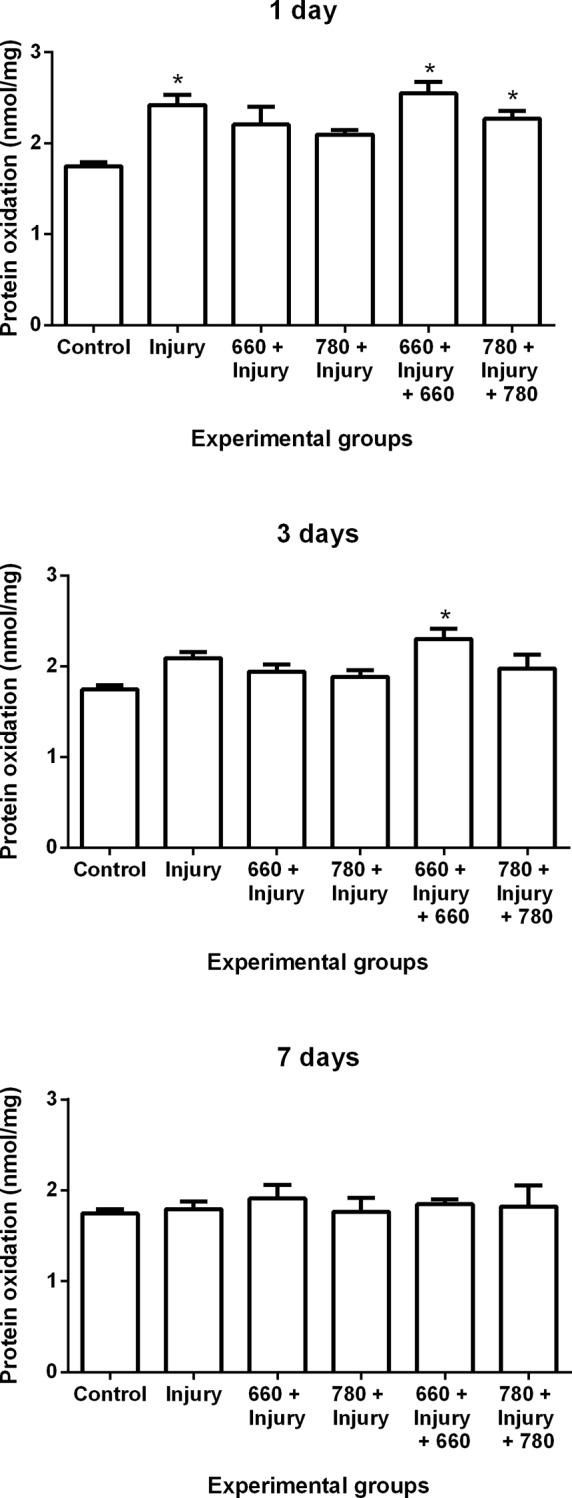
ANOVA/Tukey’s test; *p ≤ 0.05 compared to control group
Official websites use .gov
A
.gov website belongs to an official
government organization in the United States.
Secure .gov websites use HTTPS
A lock (
) or https:// means you've safely
connected to the .gov website. Share sensitive
information only on official, secure websites.
ANOVA/Tukey’s test; *p ≤ 0.05 compared to control group