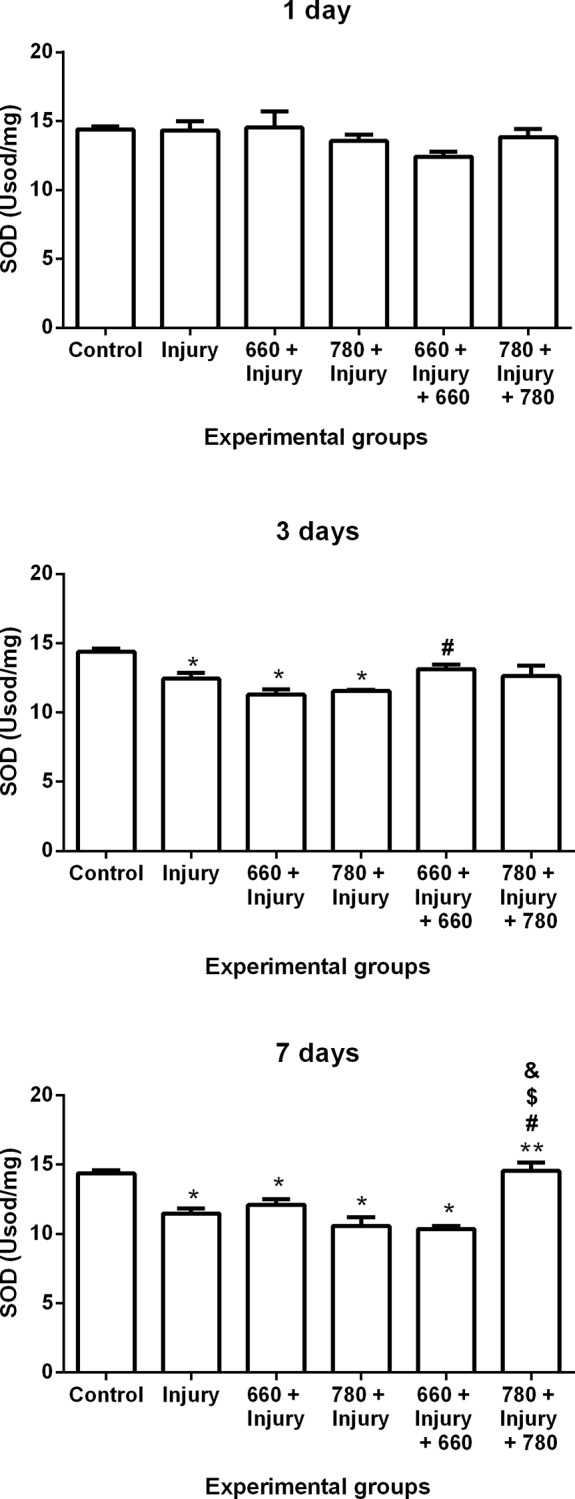
Fig 3. SOD activity in different experimental groups; values expressed as mean and SEM; ANOVA/Tukey’s test; *p ≤ 0.05 compared to control group; **p ≤ 0.05 compared to injury group; #p ≤ 0.05 compared to 660 + injury group; $p ≤ 0.05 compared to 780 + injury group; &p ≤ 0.05 compared to 660 + injury + 660 group.