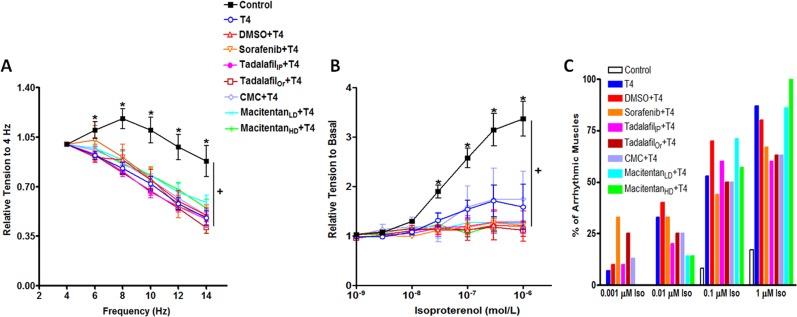
Fig 2. Physiological Modification of the Contractile Force of Isolated Right Ventricular Papillary Muscles.
(A) Frequency-dependent activation; Isometric developed force values are expressed as a fraction of its corresponding value at the basal frequency of 4 Hz and presented as mean ± SEM, and (B) β–adrenergic stimulation; Isometric developed force values are expressed as a fraction of its corresponding value at the basal frequency of 4 Hz before isoproterenol addition and presented as mean ± SEM. Control; n = 12, Thyroxin (T4); n = 15, Dimethyl sulfoxide (DMSO); N = 10, Sorafenib; n = 9, TadalafilIP (intraperitoneal, 1 mg/kg); n = 10, TadalafilOr (oral, 4 mg/kg); n = 8, carboxymethylcellulose (CMC); n = 8, MacitentanLD (Low dose: 30 mg/kg); n = 8, MacitentanHD (High dose: 100 mg/kg); n = 7. Note: in the β–adrenergic stimulation curve (B), all isometric developed force values at which the muscles exhibited an arrhythmic behavior were excluded from the analysis. For example, the MacitentanHD group has no representative point at isoproterenol concentration of 1 μM, because all muscles became arrhythmic at this concentration [i.e. 7 out of 7 (100%)]. (C) Development of Arrhythmia: % of arrhythmic muscles at different isoproterenol (Iso) concentrations. The absence of the representative bar of any group at any Iso concentration on the curve means the absence of arrhythmia at this concentration. *: indicates a significant change as revealed by one-way ANOVA followed by Dunnett Multiple Comparisons post-hoc test, comparing all groups to T4. +: indicates a significant change as revealed by two-way ANOVA.

