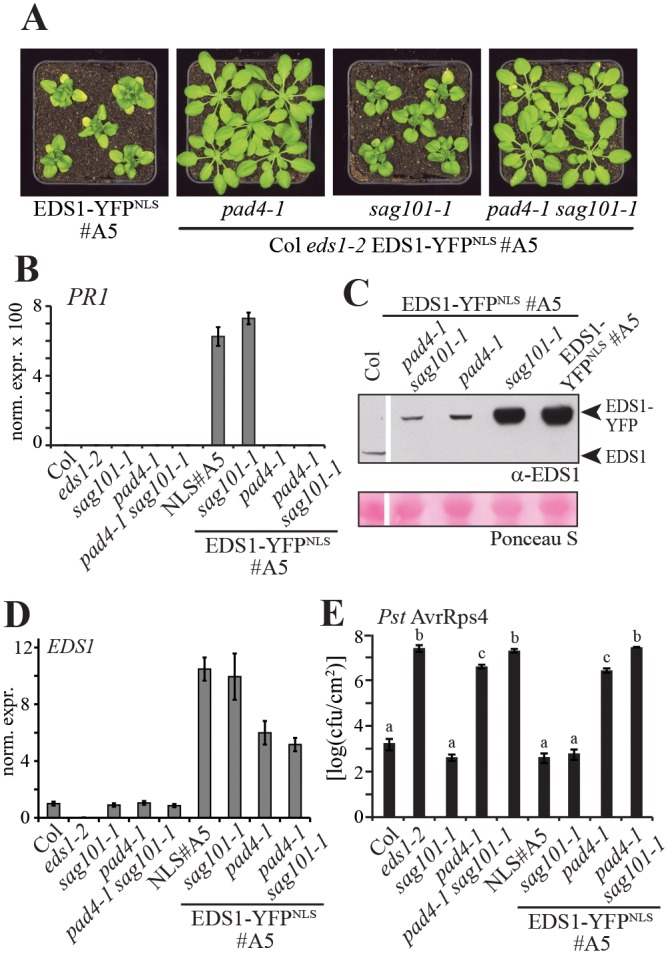
Fig 4. Genetic analysis of nuclear EDS1 autoimmunity.

A. Macroscopic growth phenotypes at 22°C of 5-week-old Col eds1-2 plants containing the EDS1-YFPNLS #A5 transgene and pad4-1 and/or sag101-1 mutations, as indicated. B. PR1 marker gene expression in different genotypes, as indicated, measured by qRT-PCR. RNA was extracted from 5-week-old plants and PR1 expression normalized to UBQ10. Standard deviation of three technical replicates is shown. C. Immunoblot analysis of total protein extracts from 5-week-old plants of the indicated genotypes separated by SDS-PAGE and probed with α-EDS1 antibodies. Ponceau S staining of the membrane is shown as loading control. The white line indicates where additional lanes from the same membrane were spliced out. D. EDS1 transcript levels measured by qRT-PCR in the same genotypes and in the same material as in (B). E. Bacterial growth of Pst AvrRps4 in leaves of the indicated plant lines at 6 dpi. Five-week-old plants were spray-inoculated and bacterial titers determined. Error bars indicate standard errors of four biological replicates. Letters indicate statistically significant differences (ANOVA, Fisher’s LSD Post-hoc test, p < 0,05).
