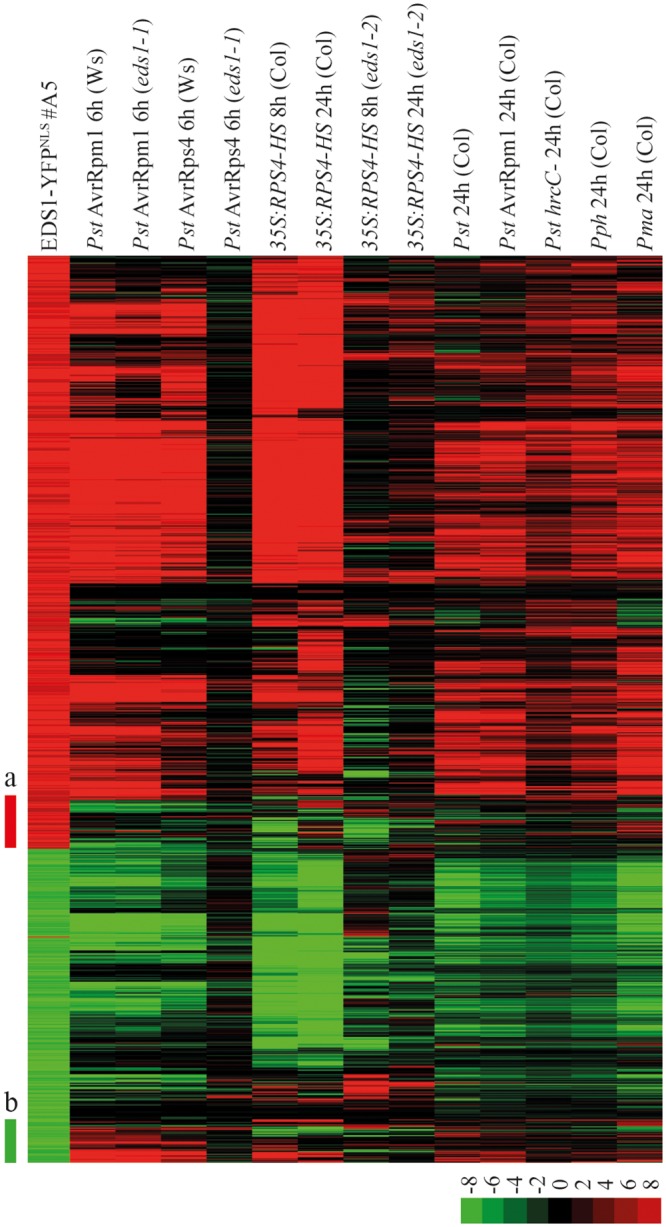
Fig 5. Transcriptome of EDS1-YFPNLS #A5 transgenic plants.

Transcript profiling was performed on ATH1 gene chips. Expression data for genes with ≥ 4-fold transcriptional changes in EDS1-YFPNLS line #A5 compared to Col were taken for used for hierarchical clustering with transcriptome data sets from bacterial NLR-conditioned PTI and ETI responses, or 35S:RPS4-HS temperature-conditioned autoimmunity. Clusters of upregulated (a, red bar) and downregulated (b, green bar) unique for EDS1-YFPNLS #A5 are marked. The color scheme represents fold-changes as indicated in the legend.
