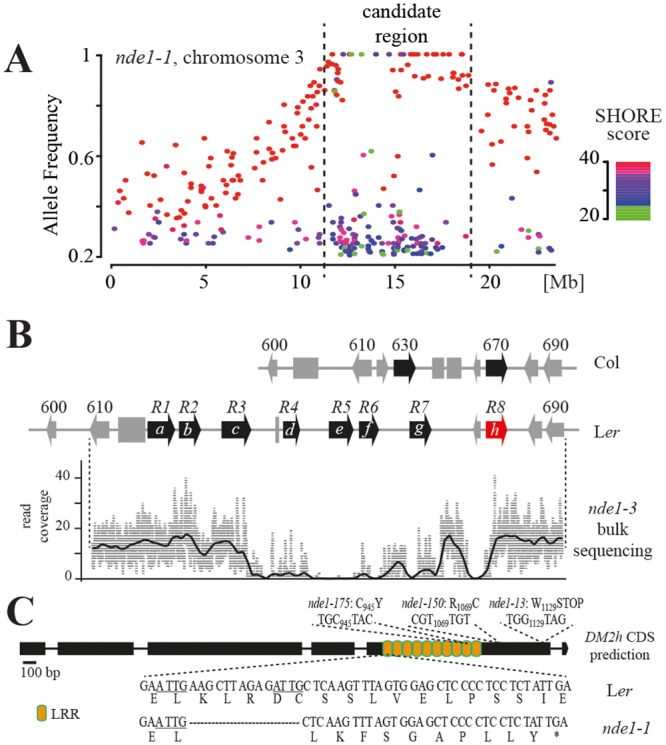
Fig 7. Mapping and identification of NDE1.

A. Bulked segregant DNA from nde1-like BC1-F2 individuals and parental EDS1-YFPNLS #A3 were Illumina sequenced. Allele frequency estimations of EMS changes on chromosome 3 in nde1-1 bulked segregants after subtraction of SNPs from the parental line are shown. SHORE score is indicative of SNP quality, with higher scores corresponding to high confidence SNPs. B. Schematic representation of the nde1mapping interval and read coverage from nde1-3 bulked segregant sequencing. The region in the Col reference genome is shown compared to accession Ler [redrawn from 18]. NLR genes, non-NLR genes and transposable elements are indicated as black arrows, grey arrows and grey boxes, respectively. The RPP1-likeLer R8 (DM2h) gene affected in nde1 alleles is highlighted in red. Numbers correspond to the last digits of At3g44XXX gene identifiers. R1-R8 (DM2a-h) mark the RPP1-likeLer genes, as described [27]. The read coverage curve was smoothened using running average and is drawn to scale with the genomic region from A. thaliana accession Ler. C. Schematic representation of the CDS prediction for RPP1-likeLer DM2h (R8) and lesions in different nde1 alleles. The CDS was predicted from genomic DNA using fgenesh+ with RPP1-WsB [63] as protein input. A 14 bp deletion detected in nde1-1 bulk segregant sequencing and point mutations detected in additional nde1 alleles with consequences for the predicted DM2h (R8) protein are shown. DM2h-LRRs (S11 Fig) are indicated in orange.
