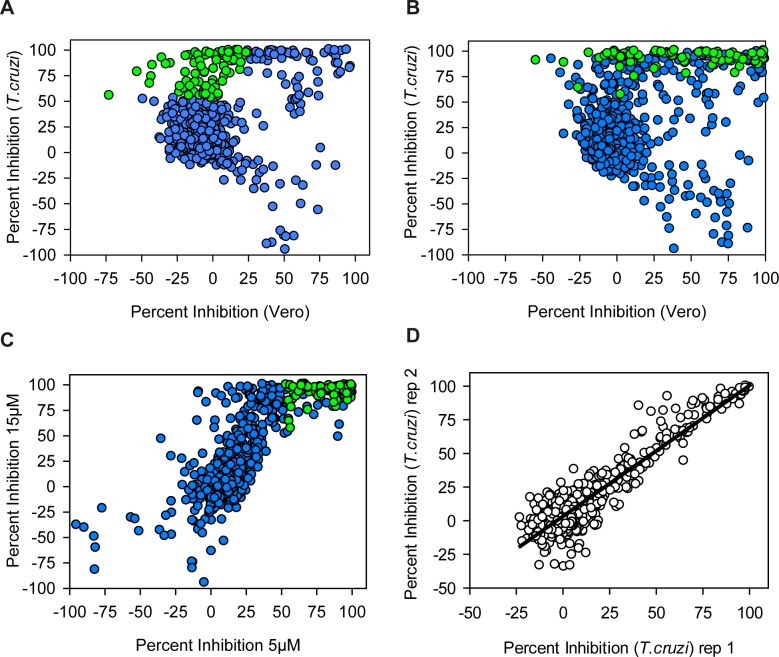
Fig 6. Results of clinical collection compound primary screen.
Panel A. Scatterplot representing the results for the screen at 5 μM. Green circles represent the hits, blue circles are all the other compounds. Panel B. Scatterplot representing the results for the screen at 15 μM. Green circles represent the hits from the 5 μM screen, blue circles are all the other compounds. Panel C. Scatterplot comparing T. cruzi percent inhibition between 5 μM and 15 μM screens. Panel D. Replicates plot for a subset of compounds screened twice at 5 μM (n = 579, R2 = 0.86).

