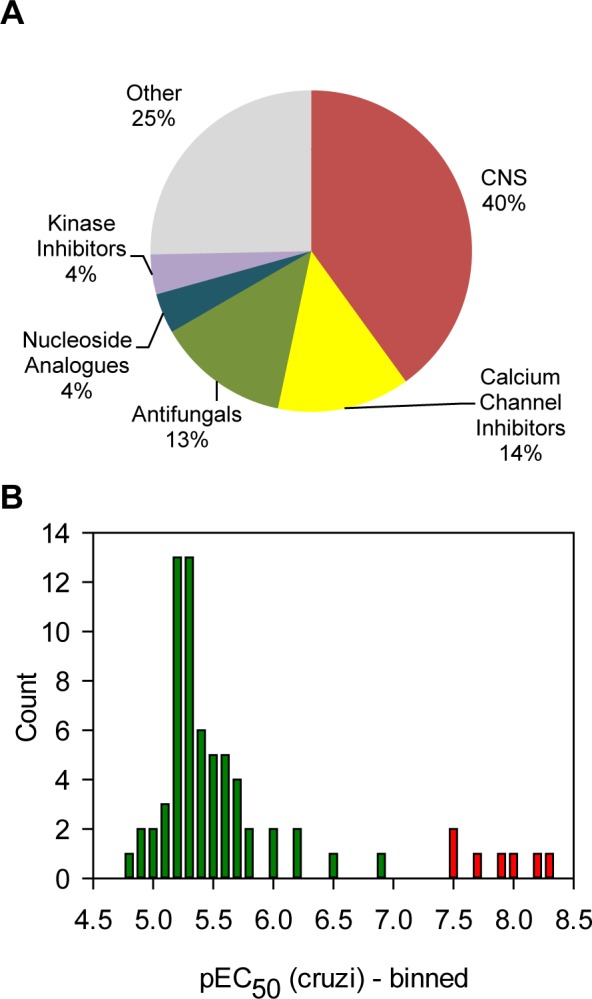
Fig 7. Analysis of the hits.

Panel A. All the hits from the 5 μM screen were annotated with a general pharmaceutical class. The chart shows the frequency for each class. Panel B. The potencies for all the hits were determined and represented as a frequency table. Bars in red represent CYP51 inhibitors, green = all other classes).
