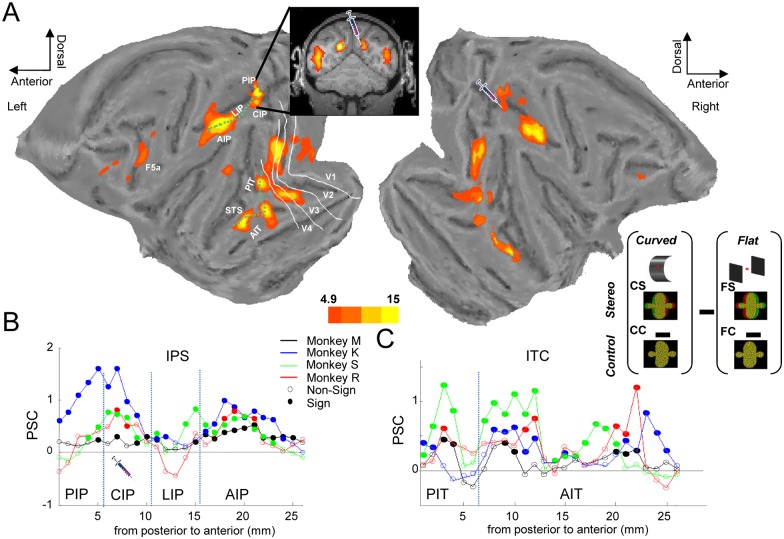
Fig 1. Overview of depth-structure related fMRI activations.
A. Group average of the [(curved stereo–curved control)–(flat stereo–flat control)] interaction effect plotted on a flat map of the M12 anatomical template. The inset shows a coronal image illustrating depth-structure related activations in the caudal intraparietal sulcus (IPS). The two green dotted lines illustrate the paths drawn through the IPS and along the inferotemporal cortex (ITC), which were used to calculate the size of the interaction effect in individual animals. The white contours indicate the borders of the early visual areas V1–V4. The picture of the injection syringe indicates the area that was inactivated in the following experiments. t values in [27]: stereo.img/hdr. B. Percent signal change of the interaction effect calculated along a path drawn along the IPS of the left hemisphere in four monkeys (black: monkey M, red: monkey R, blue: monkey K, green: monkey S). The x-axis denotes distance in millimeters along the path, with zero corresponding to the medial bank of the caudal IPS (area PIP) and 25 corresponding to the anterior tip of the IPS. Filled symbols indicate significant (curvature x disparity interaction effect) activations, open symbols indicate nonsignificant activations. Raw values in monkey_path_ips in [27]. C. Percent signal change in the interaction effect calculated along a path drawn along the ITC in four monkeys. Zero corresponds to the depth-structure activation in V4/PIT, whereas 25 corresponds to the most rostral lower bank of the superior temporal sulcus (STS). Same conventions as in B. Raw values in monkey_path_itc in [27].

