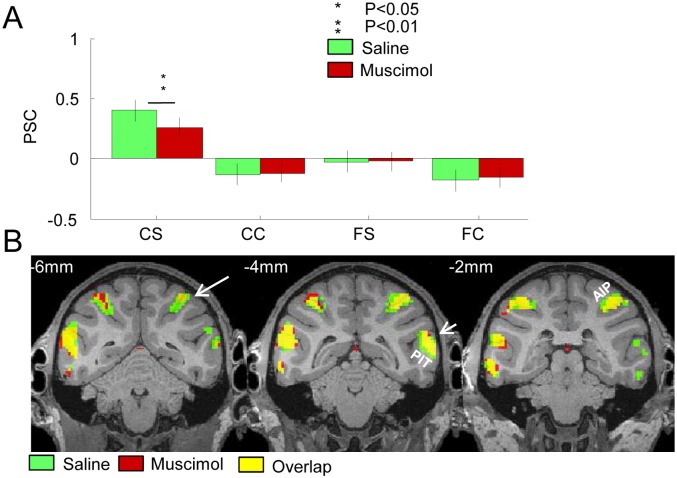
Fig 3. Effect of muscimol injection in CIP on the fMRI activations in the anterior IPS.
A. Group average percent signal change (compared to fixation) in the four experimental conditions in the anterior IPS of the inactivated (right) hemisphere. Same conventions as in Fig 2A. * = p < 0.05. ** = p < 0.01, both corrected for multiple comparisons. Raw values in [27]: aIPSr. B. Group average of the curvature x stereo interaction effect [(curved stereo–curved control)–(flat stereo–flat control)] in the anterior IPS during saline and muscimol sessions, plotted on coronal sections of the M12 anatomical template (average of three monkeys; p < 0.05 FWE corrected). The arrow in the left panel indicates the significant reduction in depth-structure-related activations in the anterior IPS (yellow voxels indicate the overlap between saline and muscimol sessions). The middle panel also illustrates the depth structure activations in PIT (short arrow), in which there was no significant effect of CIP inactivation. Same conventions as in Fig 2B. t values in [27]: stereo_sal.img/hdr and stereo_musc.img/hdr.

