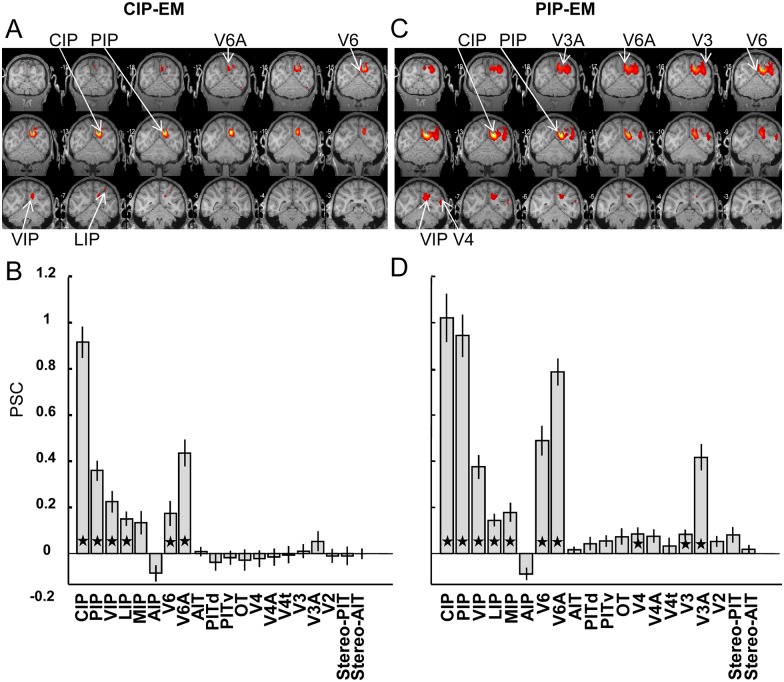
Fig 6. Effective connectivity of CIP and PIP.
A. EM-induced fMRI activations during stimulation of CIP, plotted on coronal sections of the M12 anatomical template (average of two monkeys at p < 0.05 FWE corrected). B. Percent signal change induced by CIP-EM (compared to no stimulation) in 18 anatomical ROIs and two functionally-defined ROIs (stereo-PIT and stereo-AIT). Error bars indicate standard error across runs. Black asterisks indicate significant increase in PSC compared to no stimulation (t test, p < 0.05, corrected for multiple comparisons). C. EM-induced fMRI activations during stimulation of PIP plotted on coronal sections of the M12 anatomical template (average of three monkeys). D. Percent signal change induced by PIP-EM in the same 18 anatomical and two functionally-defined ROIs (stereo-PIT and stereo-AIT). See [27]; t values in CIP-EM.img/hdr and PIP-EM.img/hdr; PSC in PSC@CIP_EM.xls and PSC@PIP_EM.xls.

