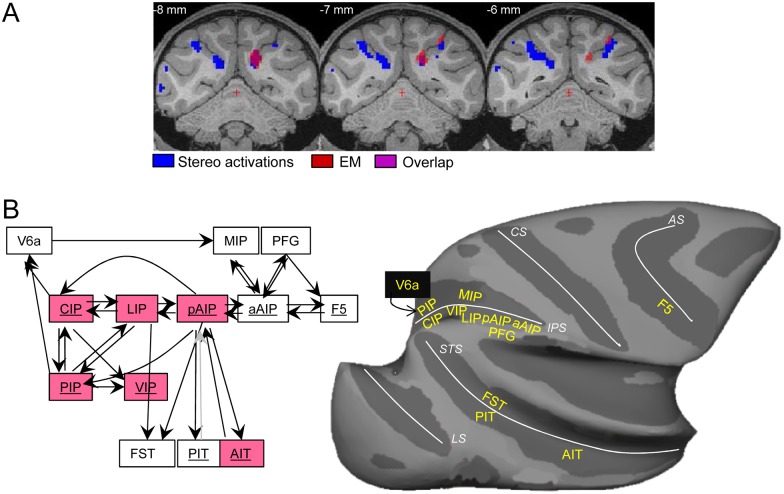
Fig 7. Overlap of depth structure activations and CIP-EM activations in the caudal IPS.
A. Depth structure activations (of monkey M, blue) and CIP-EM induced activations (red) are plotted on coronal slices of the M12 template. Overlap is indicated by the dark red color. See [27]; t values in stereo.img/hdr and CIP-EM.img/hdr. B. Schematic diagram of known functional interactions between dorsomedial, dorsolateral, and ventral visual streams, based on the results of this and a previous study. Boxes in red indicate areas or regions significantly affected by CIP inactivation, and underlined area names indicate significant depth structure activations. Dark arrows indicate effective connectivity based on anatomical tracer and/or EM-fMRI studies. The gray arrow from PIT to pAIP is presumed connectivity based on the bidirectionality of most cortico-cortical connections. C. Inflated macaque brain displaying the main cortical areas implicated in stereo processing, and their connected areas. IPS: intraparietal sulcus; CS: central sulcus; AS: arcuate sulcus; LS: lunate sulcus; STS: superior temporal sulcus.

