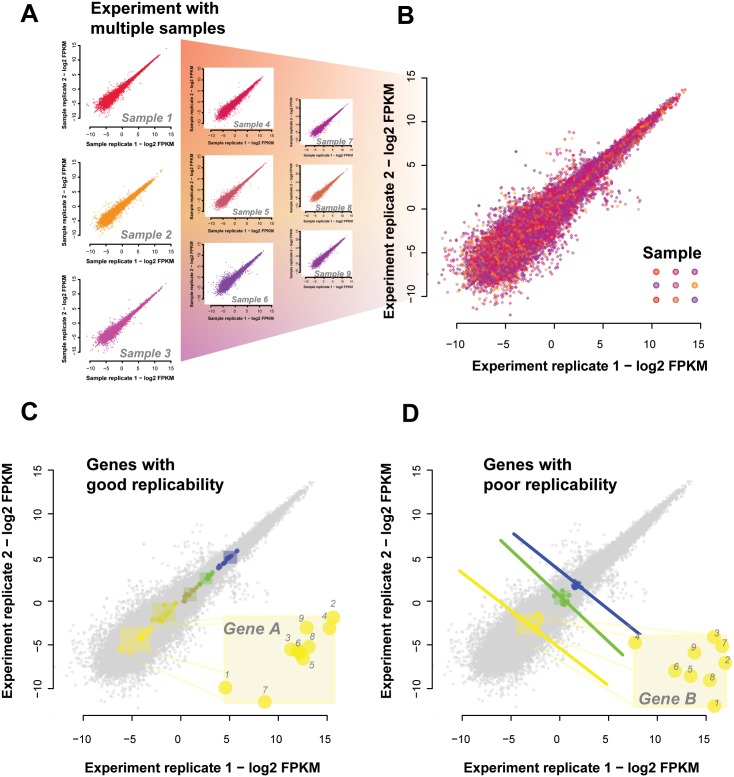
Fig 2. Simpson’s paradox in expression data.
(A) Sample-sample replicability plots are possible for each of the 18 conditions tested. Shown are a representative set of 9 sample-sample plots. Each point represents a gene with X and Y values being the two expression measures, i.e., original and replicate. Different samples are shown in different colors. (B) We overlay all these individual sample-sample plots onto the same axes to give the aggregate view of expression across samples and their replicates. This allows us to determine replication of gene variation across samples. (C) Some genes replicate well; changing their expression in a consistent way across samples and their replicates. We have highlighted genes which are positively correlated with their replicate across the samples and also have no overlapping dynamic ranges. Note that sample-sample correlations across this set of genes would be high even if the labels identifying samples were permuted (inset of “Gene A” shows labelled samples). (D) There are also genes which are negatively correlated with their replicates across samples (inset of “Gene B” shows labelled samples). And because they also do not have overlapping dynamic ranges the sample-sample correlation across these genes would remain high for any given sample pair.

