
Fig 4. Self-correlation (replicability) and co-expression.
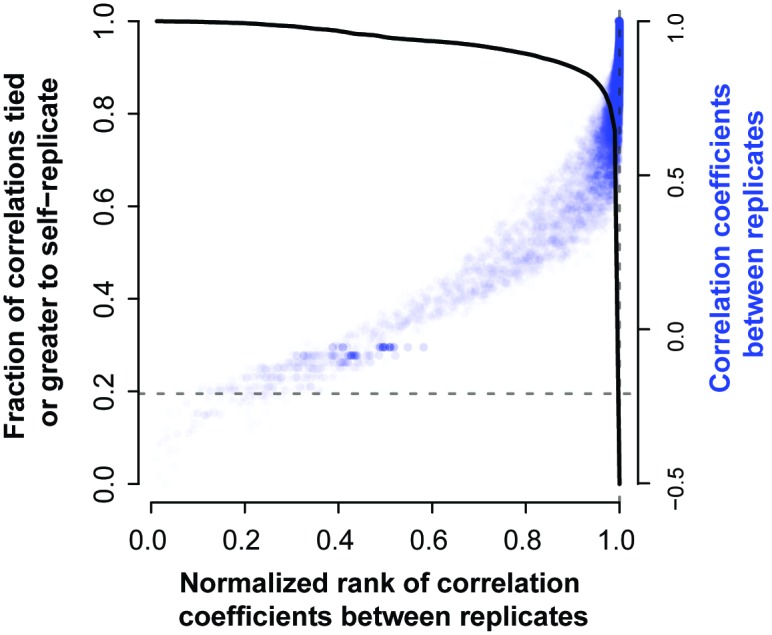
The degree of correlation between a gene and its replicate is plotted relative to all other genes (relative rank). As would be expected, as the correlation between a gene and its replicate (across the same conditions) rises, the rank of that correlation relative to the value between the given gene and all others also rises. However, the true replicate is only most similar to the given gene in ~20% of cases (solid black line, 4,024 genes), i.e., the solid line is at 0.2 when the rank is exactly 1 (dashed lines). The steep fall off in this trend shows that most replicates are at least very highly ranked by the correct gene.