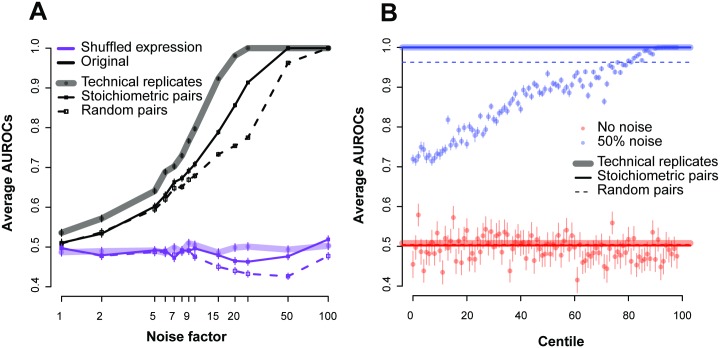
Fig 8. Estimating replicability using different gene-pairs.
(A) Comparing the use of co-expressing pairs (solid), actual replicates (shaded) and random pairs (dashed) for the ENCODE dataset. Each point gives the average AUROC for detecting a noisy sample in the data across the varying noise factors. The sample size here was held constant at 18. The black lines are the original expression values, and the purple lines are those where we randomized the expression values (shuffling within an experiment). (B) Performance of the centiles for the experiment with and without the addition of noise. We only show the 50% noise factor. The replicates and stoichiometric pairs show very similar performance at this noise level (AUROC~1).

