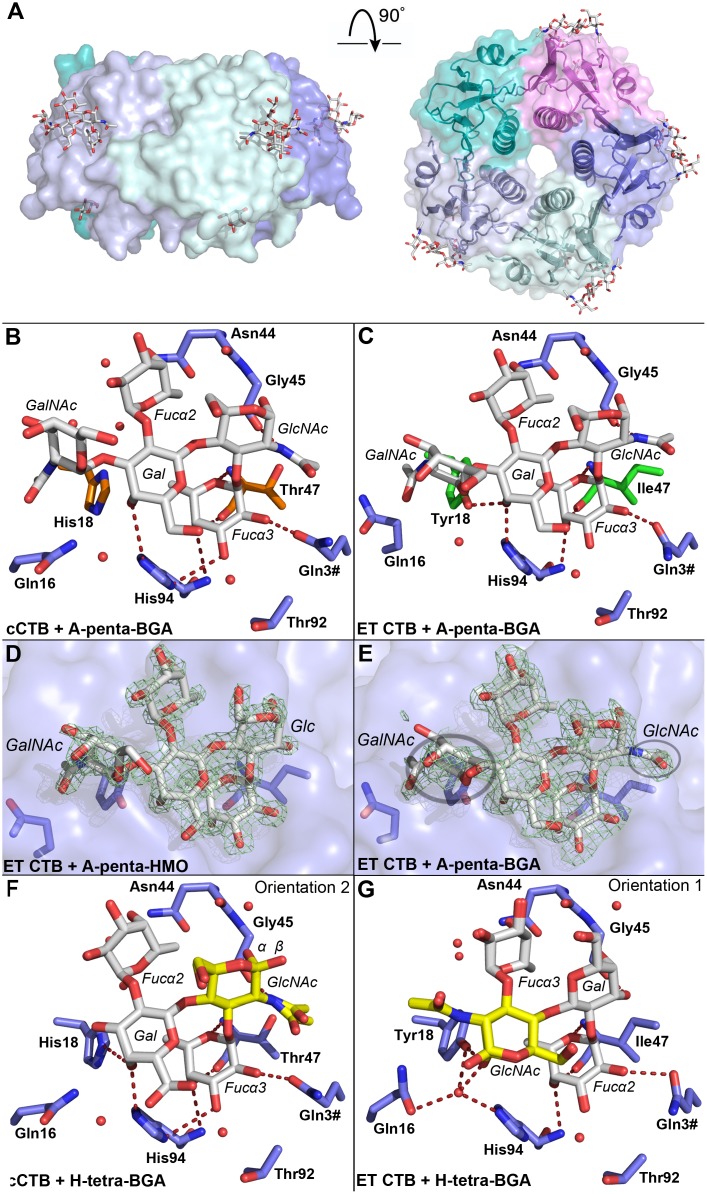
Fig 2. Blood group antigen binding to the cholera toxin.
(A) X-ray structure of cCTB in complex with A-penta-BGA (PDB ID: 5ELD); side and top views. The B-pentamer is colored by subunit, and the ligands are shown in stick representation. Blood group determinants are bound to the lateral side of the toxin (modeled into four of the five secondary binding sites), and galactose to the primary binding site (in three of the sites), facing the cell membrane. (B-G) Close-up views of the blood group antigen binding sites. Oligosaccharide residues are labeled in italics, amino acid residues in bold, and residues from neighboring subunits are indicated with a hash (#). (B-C) Interactions of the blood group A determinant with cCTB and ET CTB. Biotype-specific residues are highlighted in orange and green sticks. Water molecules are shown as red spheres, and hydrogen bonds are depicted as red dashed lines. (D-E) Electron density. σ A-weighted F o − F c maps (green mesh; contoured at 3.0σ) are shown for the blood group A determinant and a human milk oligosaccharide. The maps were generated before insertion of the ligands. Circles indicate special features: the GlcNAc’s N-acetyl group, and the less-defined electron density for GalNAc in A-penta-BGA. (F-G) Interaction of the blood group H determinant with cCTB and ET CTB (two orientations). Yellow residues mark the reducing-end GlcNAc, α and β anomers are labeled. Water molecules are depicted as red spheres, hydrogen bonds represented by red dashed lines. In B, C, F and G, only those H-bonds are shown that have favorable angles, maximum bond lengths of 3.5 Å and that are conserved in all binding sites.

