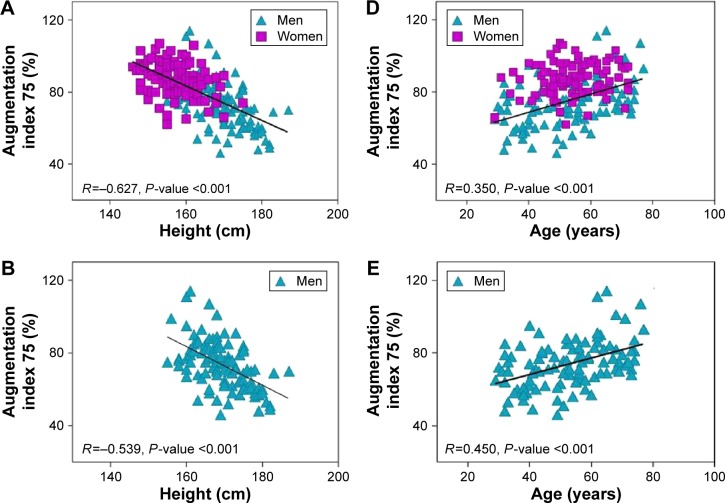
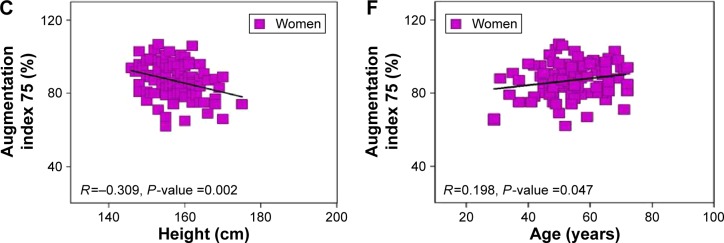
Figure 2.
Pearson’s correlation of AIx 75 with height and age in patients with hypertension.
Notes: (A and D) AIx 75 was shown to have inverse correlation with height and positive correlation with age in patients with hypertension. In the Pearson correlation and Hotelling test, the slope of the association between height and AIx 75 was significantly stronger than the slope of the association between age and AIx 75 (t=3.615, P-value =0.005). (B and C) In Pearson’s correlation analysis using Fisher’s Z-transformation, the slope of the association between height and AIx 75 showed no difference in men and women (Z =1.191, P-value =0.222). (E and F) The slope of the association between age and AIx 75 was significantly stronger in men (Z =1.994, P-value =0.043). Solid lines indicate the regression trend lines.
Abbreviation: AIx 75, augmentation index 75.


