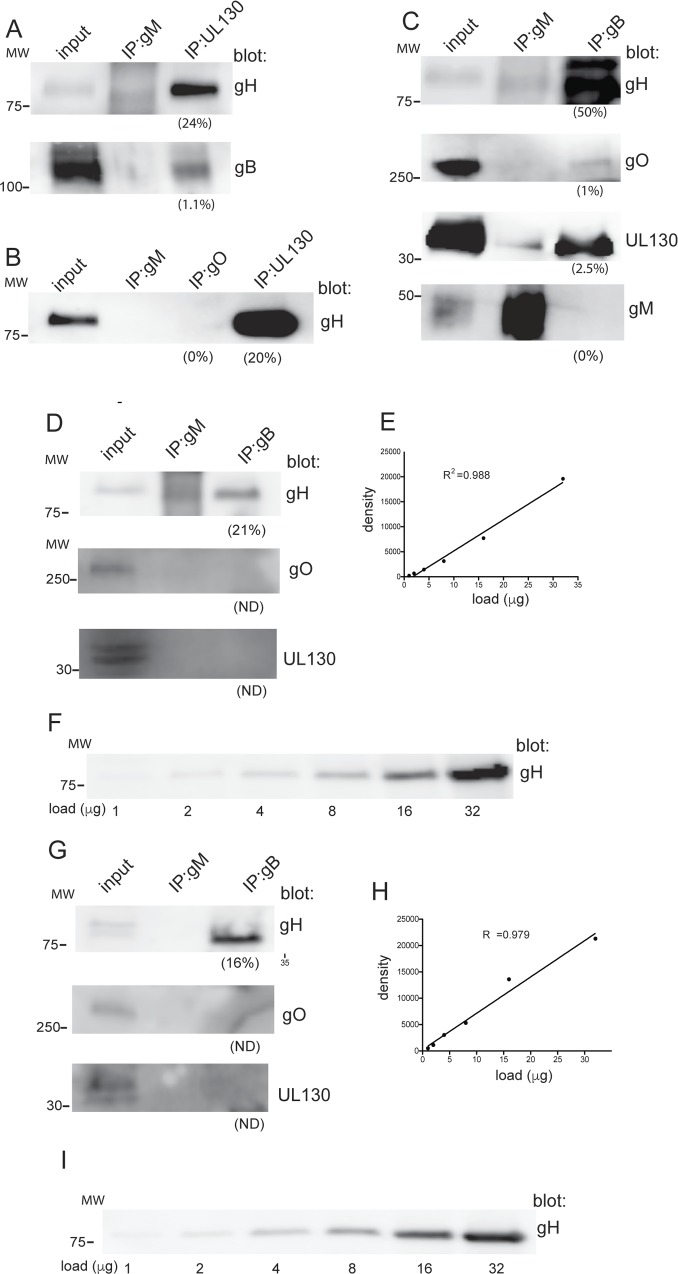
Fig 7. HCMV gH/gL/gO and gH/gL/UL128-131 do not significantly complex with gB in virions.
HCMV BADrUL131 extracellular virus particles were partially purified from cell supernatants harvested10 days post -infection then solubilized in 1% NP-40 and insoluble proteins removed by centrifugation. (A) Proteins from virion extracts were IP’d using rabbit polyclonal anti-peptide antibodies specific for UL130 or a gM-specific MAb as a negative control and the IP’d proteins separated by SDS-PAGE and analyzed by western blot with gH-specific MAb AP86 or gB-specific MAb 15H7. (B) Proteins were IP’d from detergent extracts of HCMV virions with rabbit polyclonal antibodies specific for UL130, rabbit polyclonal anti-peptide serum specific for gO (TBgO) [23] or with a gM-specific MAb and the IP’s analyzed by western blot as described above with the gH-specific MAb AP86. (C) Detergent extracts of extracellular HCMV virus particles were solubilized then extracts IP’d with anti-gM MAb or anti-gB MAb 15H7 (as indicated along the top of the panel). The precipitated proteins were analyzed by western blot with anti-gH MAb AP86, rabbit anti-gO (TBgO) sera, rabbit anti-UL130 sera, or a gM-specific MAb (as indicated along the right side of the panel). (D) IP-western blot analyses of solubilized BADrUL131 extracellular virions as described for panel C, except that the membrane blotted for gH from the gB IP was exposed along side a linear range of input samples derived from a gH/gL expressing cell lysate. (E) Linear curve of the gH signal generated after exposure of the membrane containing the increasing doses of the gH-gL expressing lysate. The y-axis indicates the relative density of the protein bands and the x-axis indicates the amount of lysate loaded into each well. (F) Shown is the exposure of the western blot containing the increasing amounts of the gH-gL expressing lysate. The amount to gH/gL expressing lysate loaded into each well is indicated below the panel. (G) Western blot analyses as described for panel D except IP’s were performed with solubilized extracellular virions derived from the clinical strain TR. (H) Linear curve of the gH signal containing the increasing doses of the gH-gL expressing lysate as described for panel E. (I) Shown is the exposure of the western blot containing the increasing amounts of the gH-gL expressing lysate. The amount to gH/gL expressing lysate loaded into each well is indicated below the panel. To assess the relative quantity of IP’d proteins, we compared the signal intensities of the IP’d proteins to the input protein signal intensities. Analysis was performed using ImageJ software (panel C) or Image Studio software (Licor) for panels 7D-7I. For all blots, input refers to 5% of the virion lysate loaded directly into gels. The percent of the total protein IP’d compared with the total in the virion extract is shown under each lane. Molecular mass (MW) markers are indicated on the left. All samples were analyzed by SDS-PAGE under reducing conditions with the exception of samples involving the detection of gO, which required that that SDS-PAGE be performed under non-reducing conditions, thus the signal for gO represents the gH/gL/gO disulfide linked >250 kDa trimer. ND indicates not detected.

