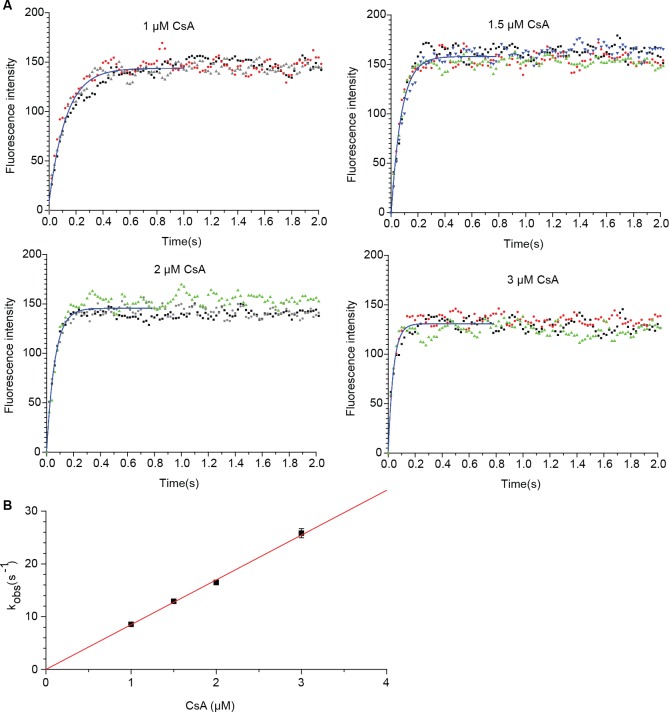
Fig 2. Association rate measurement using stopped flow method.
(A) Fluorescence intensity time courses of Cyp18 (final concentration of 250 nM) upon the addition of various concentrations of CsA using stopped flow. The concentration of CsA shown in the figure is only the concentration of fast binding conformer (52.1% of the original concentration). The graph is plotted after subtraction of the fluorescence intensity of Cyp18. The raw data from the triplicates are displayed as dots and the first order global fitting as a blue line. (B) CsA concentration-dependent, linear increasing of apparent association rate of the fast phase (kobs). The kon-fast value is equated to the slope of the line.

