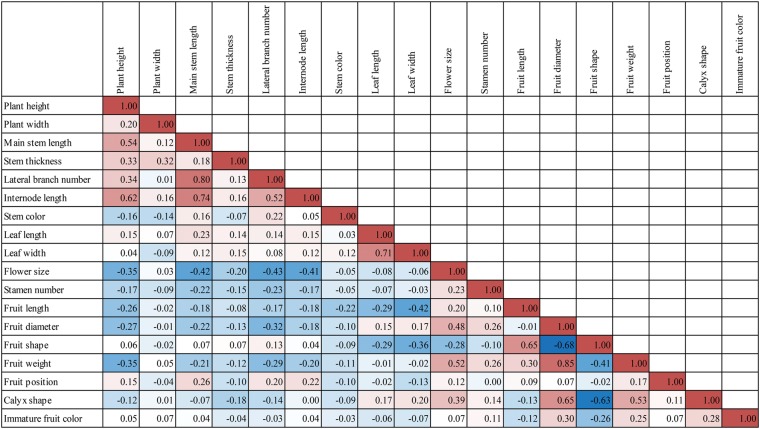
Figure 1.
Correlation between morphological traits evaluated in the RIL population. Average phenotypic values from four environments were used for Pearson correlation test. Red and blue blocks show positive and negative correlation, respectively. This figure is available in black and white in print and in colour at DNA Research online.

