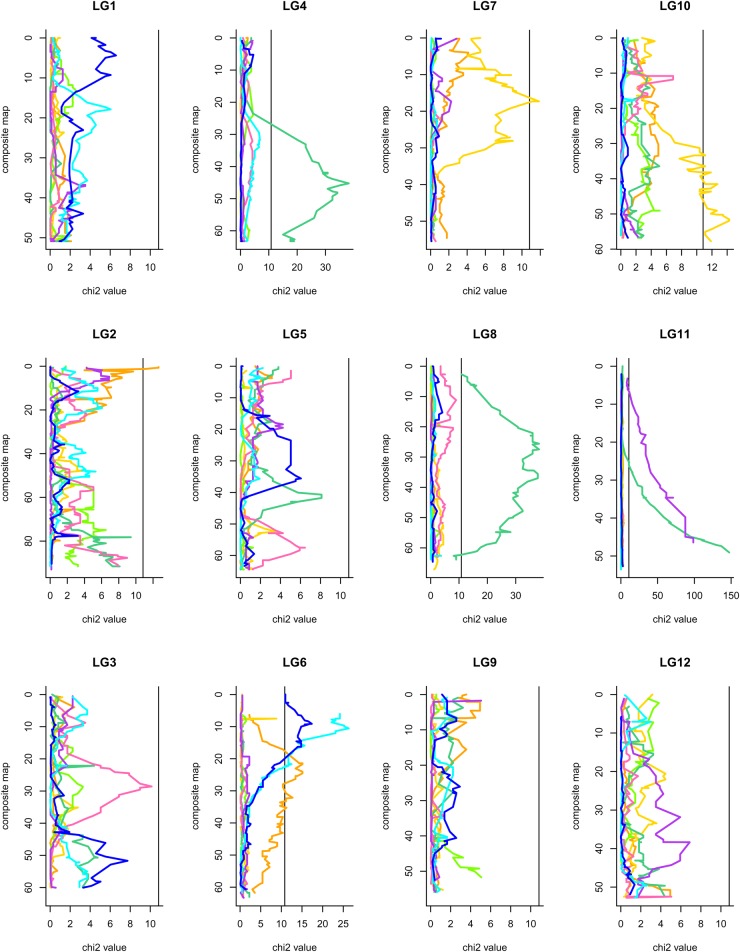
Figure 2.
Distribution of SD for the 12 LGs for the 8 parental maps, α = 0.001. The vertical line corresponds to a type I error of 0.001. The x-axis corresponds to the χ2 value and the y-axis corresponds to the map length of the LG in cM. The black vertical line corresponds to the χ2 threshold value, orange line corresponds to P1f, yellow line: P1m, light green: P2f, dark green: P2m, pink: P3f, violet: P3m, light blue: P4f and dark blue: P4m.

