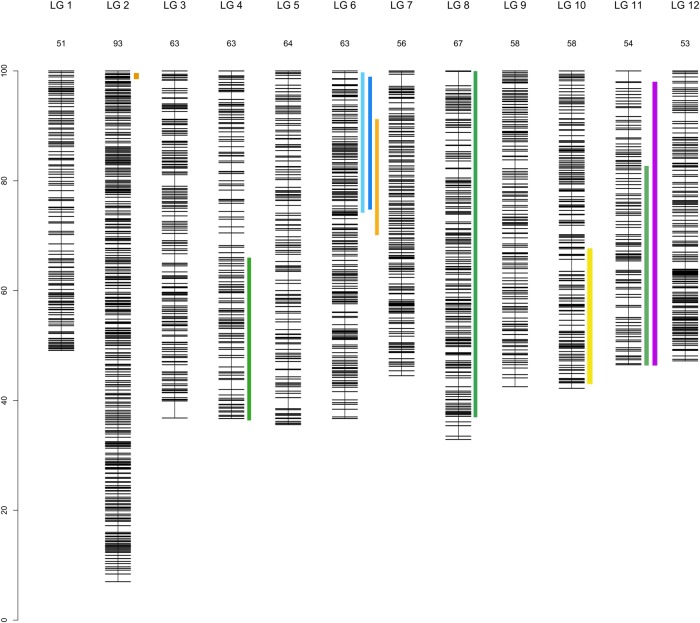
Figure 4.
Composite linkage map for the 12 LGs and localization of the 9 segregation distorted regions (SDRs). The SDRs are represented by a vertical colour trait along the LG2, in orange: P1f, LG4, in dark green:, P2m, LG6, left to right, in light blue: P4f, dark blue: P4m, orange: P1f, LG8, in dark green: P2m, LG10, in yellow: P1m, LG11, in dark green: P2m, in violet: P3m). The LG size in cM is given in the LG name. This figure is available in black and white in print and in colour at DNA Research online.

