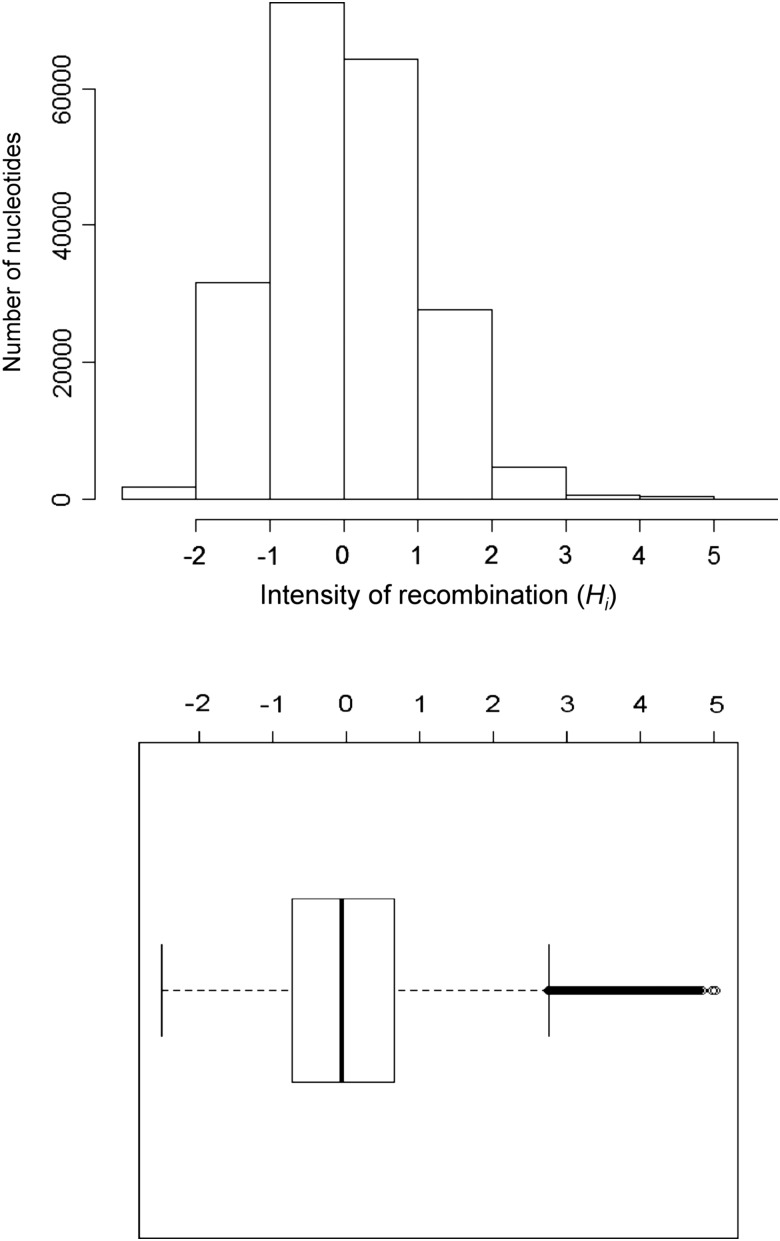
Figure 4.
Distribution of estimated intensity of homologous recombination per nucleotide (Hi) in the H. pylori genome. In the box plot at the bottom, a bold vertical line indicates median, while the left and right of a box indicate 25th and 75th percentiles, respectively. The left whisker indicates the lowest value within the 25th percentile − 1.5 interquartile range, whereas right whisker indicates the highest value within the 75th percentile+1.5 interquartile range.

