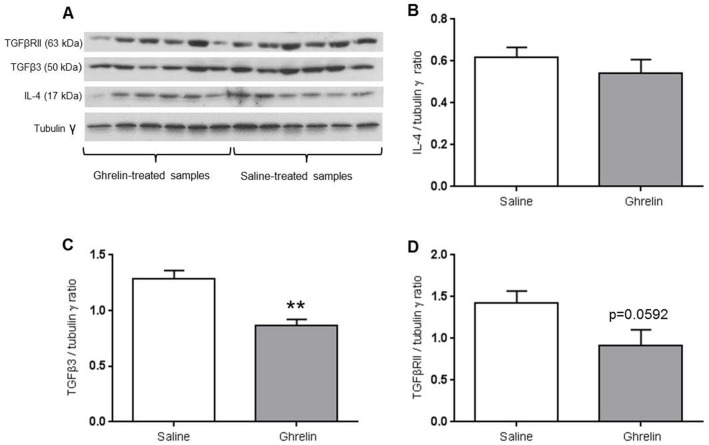
Fig 5. Western blot analysis of TGFβ3, TGFβR2 and IL-4 protein levels.
The protein levels of TGFβ3 (A,C) and TGFβR2 (A,D) were reduced in the ghrelin-treated samples (n = 6) compared to the saline-treated samples (n = 6) at 4 days post-surgery. No significant differences were detected for IL-4 protein levels (A,B). Data are expressed as mean ± SEM and analyzed by Student’s t-test (** p <0.01).

