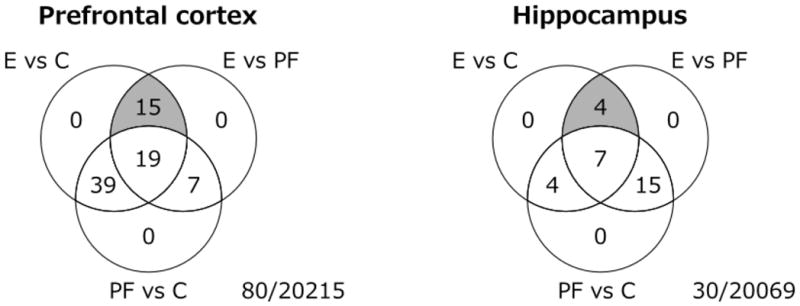
Figure 1. Prenatal treatment alters gene expression patterns under steady-state conditions.

Venn diagram of the number of the number of probes significantly altered in each contrast at Day 16 post-saline injection, with moderated F-statistic q <0.25 and moderated t-statistic p <0.05 (80 in the PFC, 30 in the HPC). The number of probes with unique effects in PAE versus both PF and C animals are highlighted in grey, and listed in Table 1. The center of each Venn diagram shows the number of probes differentially expressed among all three prenatal treatment groups. The intersection on the left of each diagram shows the number of probes with a common effect of prenatal ethanol exposure and pair-feeding. The intersection on the right of each diagram shows the number of probes with a unique effect of pair-feeding.
