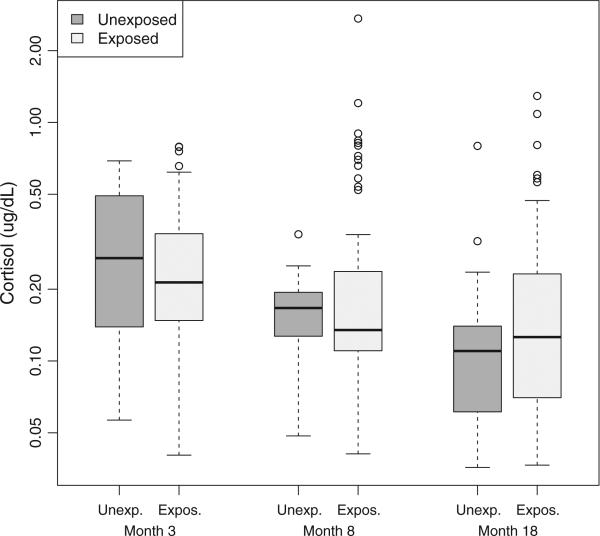
Figure 1.
Box plots for resting salivary cortisol at 3, 8 and 18 months CA by study group. Box plots: Cortisol values for exposed and non-exposed infants at each visit (median, interquartile range). Minimum and maximum limits shown with outliers identified as circles if the value exceeded the top or bottom quartile by more than 1.5 times the interquartile range.

