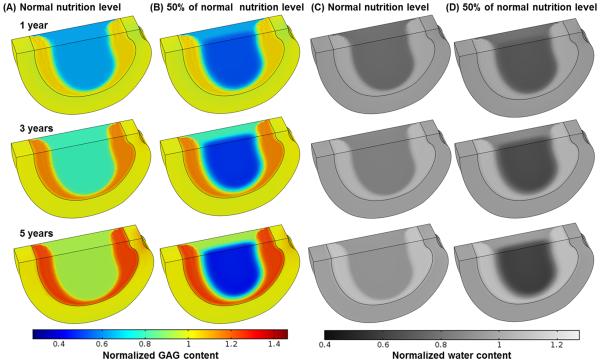
Figure 5.
Comparisons of treatment outcomes in the severely degenerated disc treated with a cell density of 8000 cells/mm3 in Case I between normal nutrition level and lower nutrition level (e.g., 1.6 mM for glucose, and 1.8 kPa for oxygen on the NP surface, while normal level remains on AF periphery): (A-B) GAG content, (C-D) water content.

