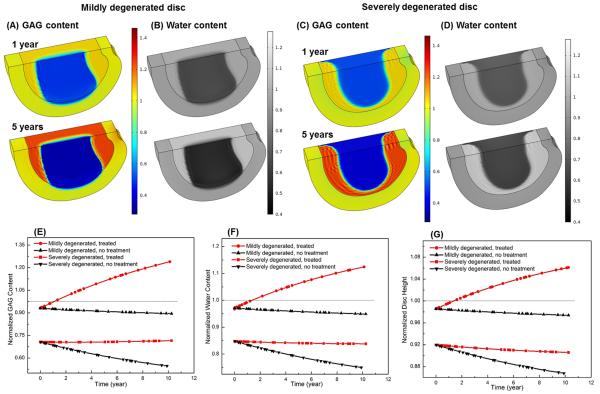
Figure 7.
Comparison of treatment outcomes between mildly and severely degenerated discs and between non-treated (control) and treated discs in Case II (i.e., increasing GAG synthesis rate in the NP): spatial distributions of GAG content (A, C) and water content (B, D), and temporal variations of GAG content (E), water content (F), and disc height (G). The treatment is under normal nutrition level at the disc boundary. All the values are normalized to that at the healthy state. Values in (E) and (F) are averaged over NP.

