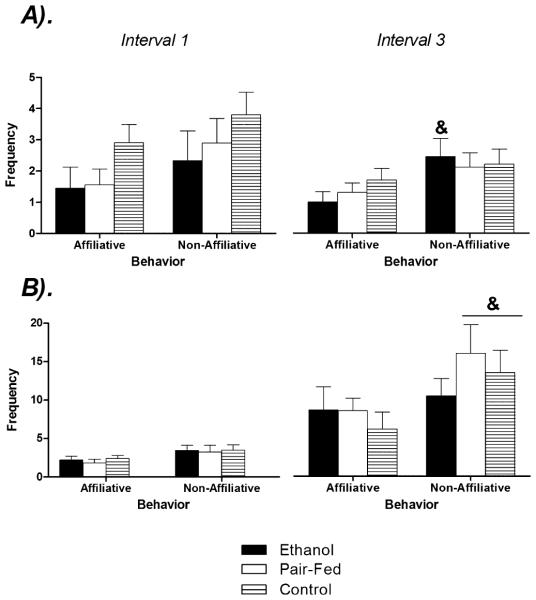
Fig. 7.
Effects of prenatal group and sex on the frequency of behaviors in the social interaction test. Data represent the frequency of affiliative and nonaffiliative behaviors among (A) males and (B) females in the first (0 to 5 minutes) and third (11 to 15 minutes) intervals of a 15-minute test. & denotes significantly different than affiliative behaviors in the third interval. n’s = 8 to 10 for each condition; p’s < 0.05.

