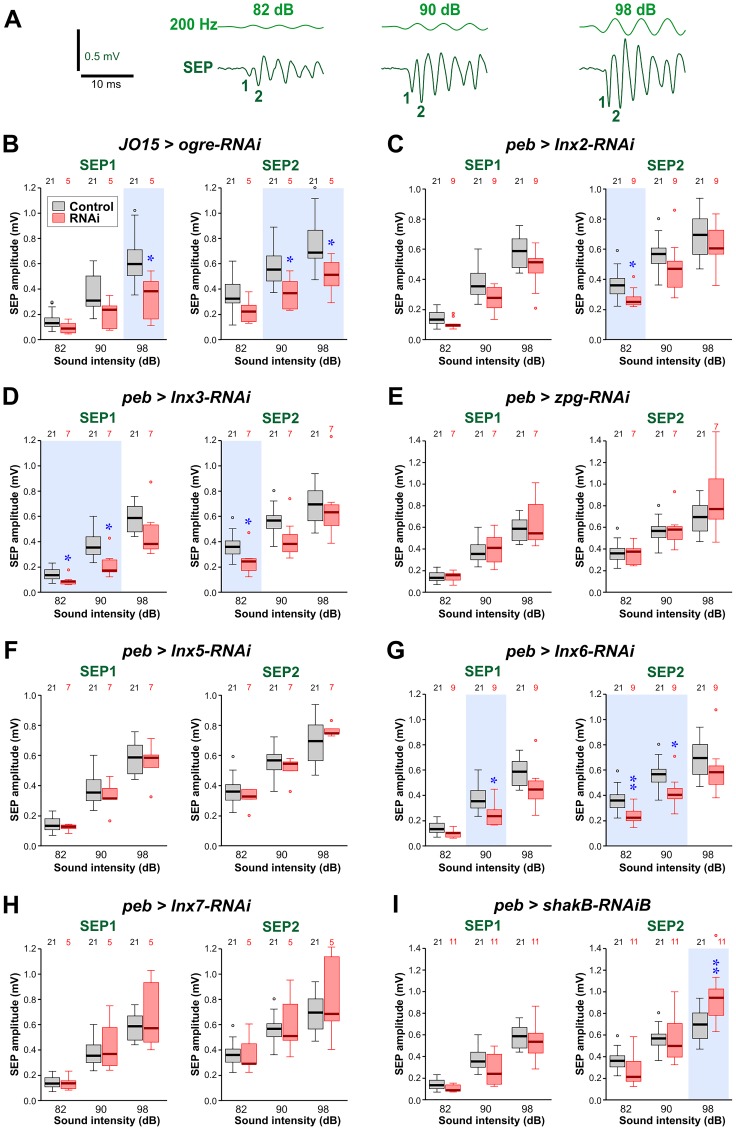
Fig 2. Effects of Innexin knockdown on the amplitudes of sound-evoked potentials.
(A) Sample traces of sound-evoked potentials (SEPs) recorded from the base of the antenna, in response to 200 Hz sound pulses. As the sound level is increased (dB), the SEP amplitude also increases. The first two SEPs in the train are numbered 1 and 2. (B-I) Amplitudes of SEP1 and SEP2 in animals with RNA interference constructs targeting different innexins, compared to controls (JO15-GAL4/+ in B and peb-GAL4 > Dcr-2 in C-I). Paired t-tests or Mann-Whitney tests (with a Bonferroni correction for 3 comparisons) were used to determine significant differences from control. These are indicated with blue asterisks and a light blue background tint. (B) JO15-GAL4 driving ogre-RNAi (short hairpin, so Dcr-2 not required). The JO15-GAL4 driver was used instead of peb-GAL4, which proved lethal. Both SEPs were reduced at higher sound intensities. (C) peb-GAL4 driving Inx2-RNAi (short hairpin). A reduction was seen in SEP2 at low intensity. (D) peb-GAL4 driving Inx3-RNAi and UAS-Dcr-2. Both SEPs were reduced for low or medium sounds. (E) peb-GAL4 driving RNAi of zpg (Inx4) and UAS-Dcr-2. No changes in SEPs were seen. (F) peb-GAL4 driving Inx5-RNAi and UAS-Dcr-2. No changes in SEPs were seen. (G) peb-GAL4 driving Inx6-RNAi (short hairpin). Reduction was seen in both SEPs for low and medium sounds. (H) peb-GAL4 driving Inx7-RNAi and UAS-Dcr-2. No changes in SEPs were seen. (I) peb-GAL4 driving shakB-RNAi (Bloomington short hairpin). A small increase was seen in SEP2 for loud sounds. For full genotypes see S1 Table.

