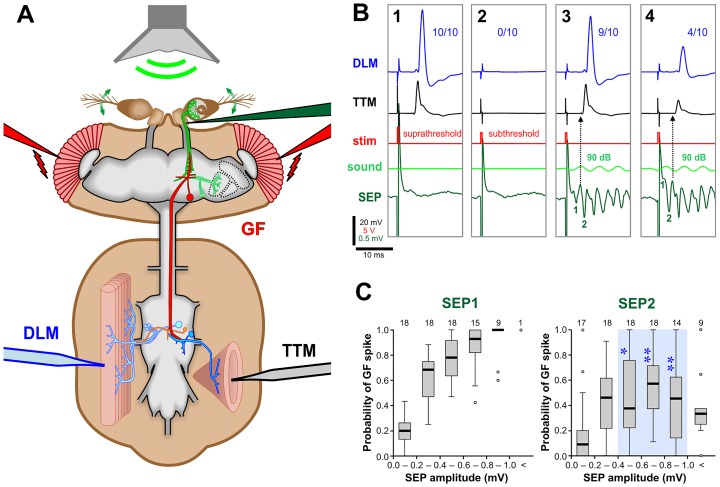
Fig 3. The strength of the synapse between JONs and the GF can be monitored through indirect recording of the GF system.
(A) Electrophysiological recording set up. A low-voltage stimulus across the eyes (red electrodes) was used to stimulate the visual pathway. A 200-Hz sine-wave sound stimulus (green) delivered with a speaker was used to stimulate the JONs. Sound-evoked potentials (SEPs) were recorded from the antennal nerve with an electrode (dark green) inserted at the base of the antenna. The output of the GF pathway was recorded from the TTM (black electrode) and the DLM (blue electrode). (B1-4) Averages of 10 recording traces. (B1) A suprathreshold voltage stimulus depolarizes the GF above threshold, resulting in action potentials in both DLM and TTM in all 10 trials (10/10). (B2) For subsequent experiments, the voltage stimulus was adjusted so that the GF was just under its threshold for action potentials (subthreshold). Note the large stimulus artifacts in the antennal nerve traces. (B3) A 90 dB sound stimulus summates with the subthreshold voltage stimulus to activate the GF. The GF fires an action potential in 9 of 10 traces, making the averaged amplitudes of the TTM and DLM spikes slightly lower than those in B1. The delay of the voltage stimulus was adjusted in order to measure the GF response to SEP1. (B4) The stimulus delay was increased to measure the response to SEP2. The GF response occurs in only 4 of 10 traces, despite the larger SEP2 amplitude, making the averaged amplitude even smaller. SEP1 is obscured by the stimulus artefact. (C) Box-whisker plots of the GF’s response to SEPs of increasing amplitudes (a measure of the strength of the synapse between JONs and GF), SEPs of different amplitudes being achieved by altering the sound intensity. An increase in amplitude of SEP1 gives an increase in GF spike probability. SEP2 has significantly less excitatory effect on GF, particularly at large amplitudes. The flies are genotype peb-GAL4; UAS-Dcr-2. Numbers of animals are indicated along the top. Statistically significant differences between SEP2 versus SEP1 (Mann-Whitney test, Bonferroni p-correction for 5 comparisons) are indicated with blue asterisks and a light blue background tint. For full genotype, see S1 Table.

