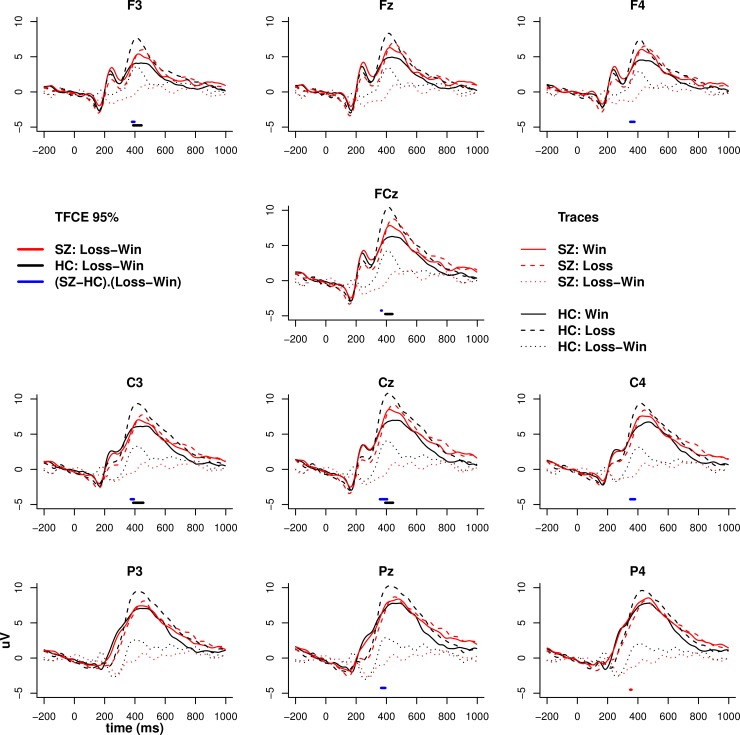
Fig 4. ERP to feedback.
ERP to wins (thumbs up; solid lines), losses (thumbs down; dashed lines) and their contrast (dotted lines) for patients and controls. Solid horizontal bars at the bottom of each trace represent Threshold Free Cluster Enhancement (TFCE) significance values at 0.05 obtained from permutation testing.

