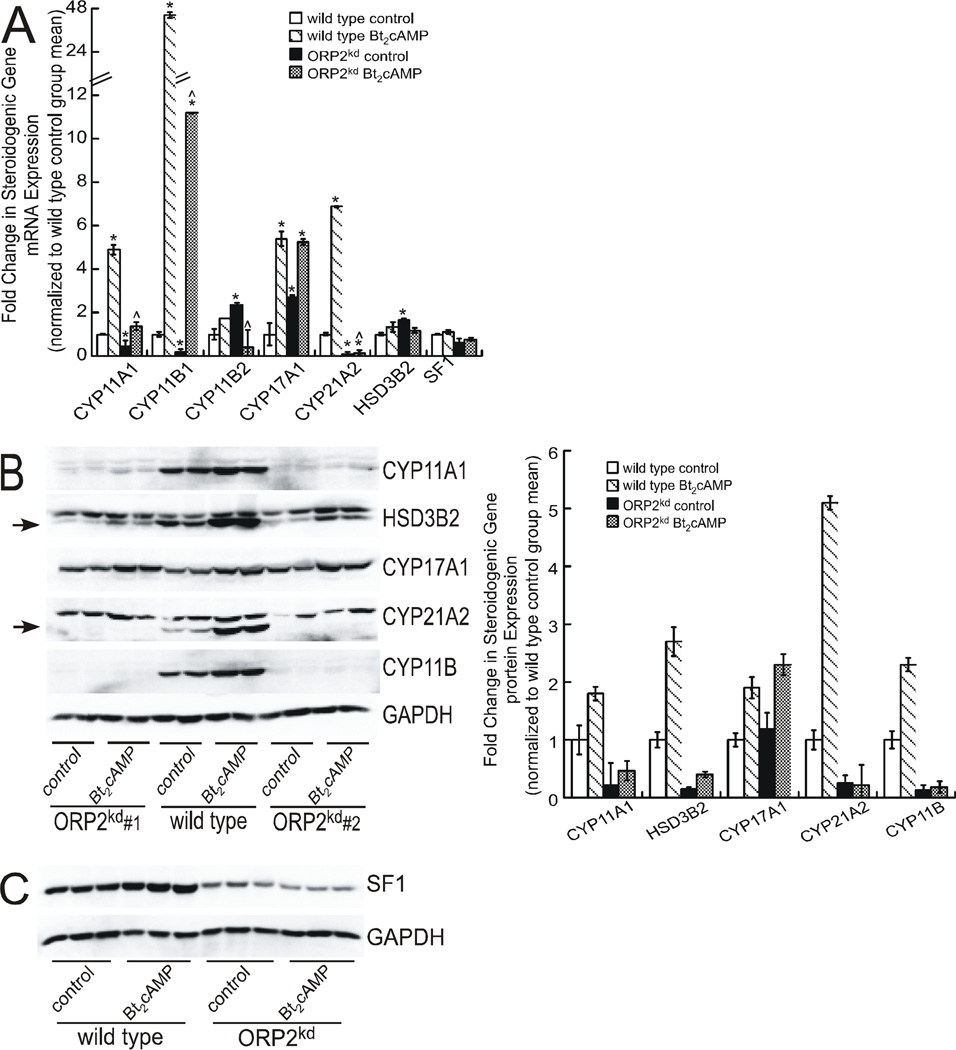
Figure 4. ORP2 suppression alters the expression of multiple steroidogenic genes.
(A) Total RNA from H295R wild type and ORP2kd cells (shRNA #1) that were treated with 0.4 mM Bt2cAMP for 24 h was isolated using RNeasy Mini Kit, standardized to 10 ng/µl, and amplified in triplicate using a One-Step SYBR Green RT-PCR Kit for CYP11A1, CYP11B1, CYP11B2, CYP17A1, CYP21A2, HSD3β2 and SF1. Gene expression was normalized to β-actin mRNA content and calculated using the ΔΔ cycle threshold (ΔΔCT) method. Data are graphed as fold change over untreated control and represent the mean ± SEM of five separate experiments, each performed in triplicate. Asterisks and carats denote statistically significant differences when compared to wild type control and wild type Bt2cAMP-treated, respectively. (B) and (C) Wild type and ORP2kd H295R cells were treated with 0.4 mM Bt2cAMP for 48 h, and whole cell lysates harvested and separated by SDS-PAGE followed by western blotting using antibodies against CYP11A1, HSD3B2 (specific band denoted by arrow), CYP17A1, CYP21A2 (specific band denoted by arrow), CYP11B and GAPDH (B) or SF1 and GAPDH (C). Shown in B and C are representative blots for assays that were performed at least four separate times, in at least duplicate. Data graphed in B represent the mean ± SEM of densitometric analysis of protein expression of shRNA#1 normalized to GAPDH. Western blot in panel C is representative data from wild type and ORPkd shRNA#1 H295R cells.

