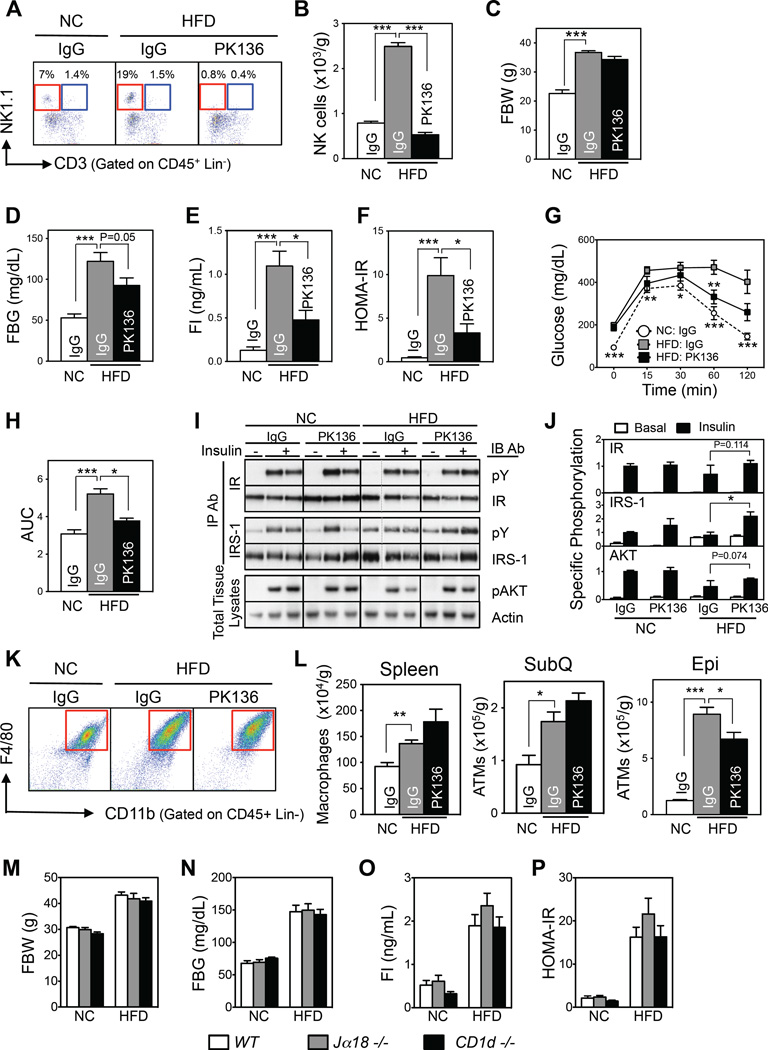
Figure 3. Depletion of NK cells by anti-NK1.1 antibody also improves HFD-induced insulin resistance.
(A–L) NK cell depletion by PK-136 antibody (n=4–5/group). (A) Representative flow cytometric plots of NK (red box) and iNKT (blue box) cells. The lineage markers (Lin) were TER-119, Gr-1, CD19, and F4/80. (B) Epididymal NK cell numbers. (C) Fasting body weight. (D) Fasting blood glucose levels. (E) Fasting serum insulin levels. (F) HOMA-IR. (G) Glucose tolerance test (GTT). (H) Area under the curve (AUC) of GTT. (I) Representative Western blot of the insulin signaling pathway in liver. (J) Quantitation of (I). (K) Representative flow cytometry plots of epididymal ATMs. (L) Macrophage numbers in the spleen, subcutaneous fat (SubQ), and epididymal fat (Epi). (M–P) iNKT cell-deficient homozygous knockout mice (Jα18−/− and CD1d−/−) (n=8–11/group). (M) Fasting body weight. (N) Fasting blood glucose levels. (O) Fasting serum insulin levels. (P) HOMA-IR. The data are presented as mean ± S.E.M. *p<0.05, **p<0.01, and ***p<0.001. See also Figure S3.

