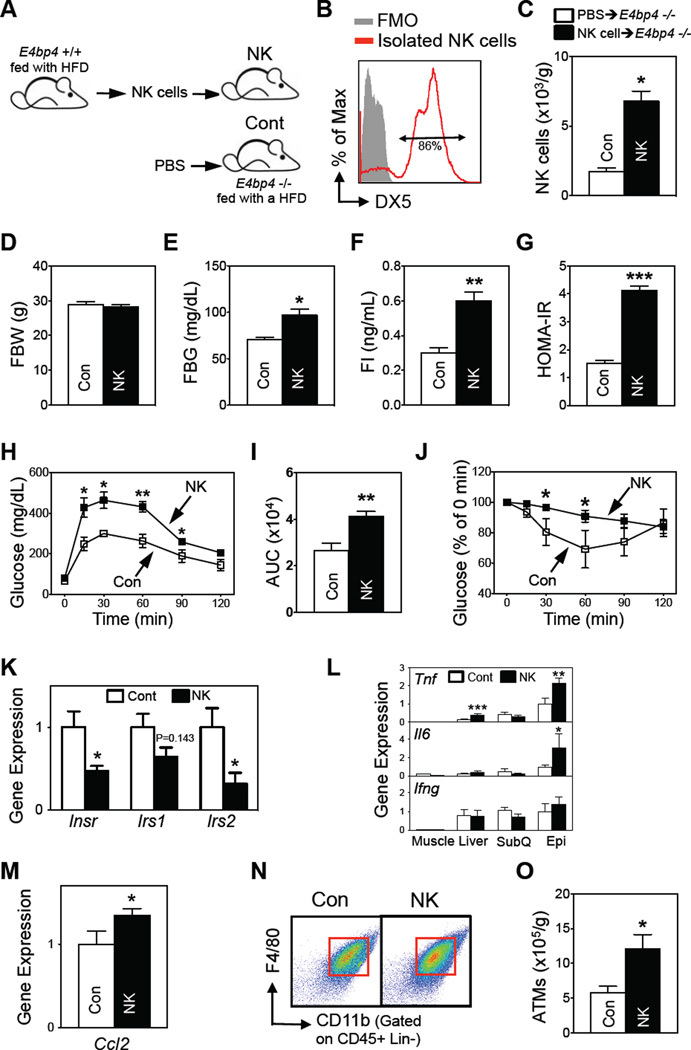
Figure 6. Reconstitution of NK cells in E4bp4 knockout mice increases HFD-induced insulin resistance.
(A) Experimental scheme for reconstitution experiments (n=4–5/group). (B) Purity of the transferred NK cells. (C) Epididymal NK cell numbers. (D) Fasting body weight. (E) Fasting blood glucose levels. (F) Fasting serum insulin levels. (G) HOMA-IR. (H) GTT. (I) AUC of GTT. (J) ITT. (K–M) Epididymal fat gene expression of insulin signaling molecules (K), inflammatory mediators (L), and Ccl2 (M), as determined by qRT-PCR. (N) Representative flow cytometric plots of epididymal ATMs. The lineage markers were TER-119, CD3, CD19, and NK1.1. (O) Total epididymal ATM numbers (n=3–4/group). The data are presented as mean ± S.E.M. *p<0.05, **p<0.01, and ***p<0.001. See also Figure S6.

