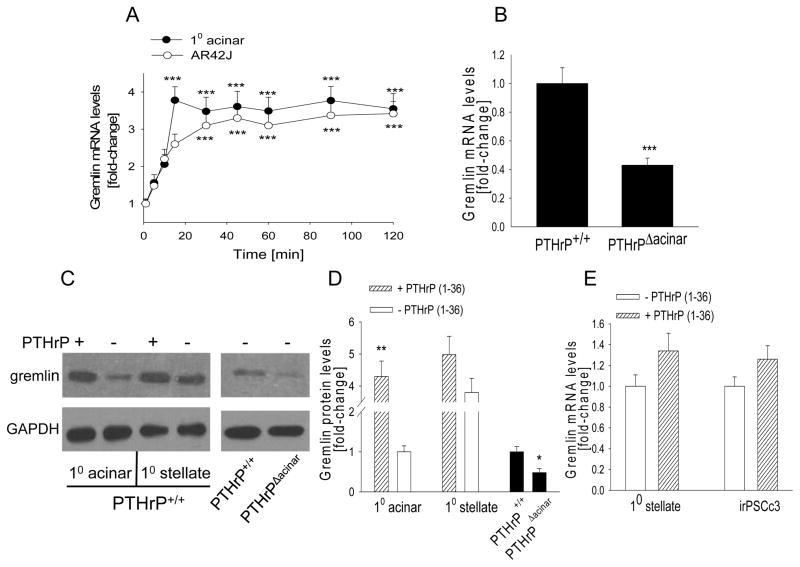
Figure 5. Effect of PTHrP on gremlin mRNA levels in acinar cells and PSCs.
(A) Acinar cells were treated with PTHrP (1-36) (10−7 M) for the indicated time intervals. (B) Gremlin mRNA levels in acinar cells isolated from PTHrPΔacinar and PTHrP+/+ mice. (C) Western blot analysis for gremlin in acinar cells and PSCs treated with PTHrP for 24 h, and in cells isolated from PTHrPΔacinar and PTHrP+/+ mice. − = control. The figure is representative of data obtained from 3 independent experiments. (D) Densitometric analysis of Western blots. (E) PSCs were treated with PTHrP (1-36) (10−7 M) for 24 h. 10 = primary cells. (A,B,E) mRNA levels were measured by reverse transcription/real-time PCR. Values are expressed relative to the 0 time point (A), the PTHrP+/+ value (B), the - PTHrP (1-36) value for acinar cells (D), and the - PTHrP value (E), set arbitrarily at 1.0. Each point or bar is the mean ± SEM of three independent experiments. ***, P < 0.001 vs. 0 time-point (A) or PTHrP+/+ value (B); **, P < 0.01 vs. respective - PTHrP (1-36) value (D); *, P < 0.05 vs. PTHrP+/+ (D).

