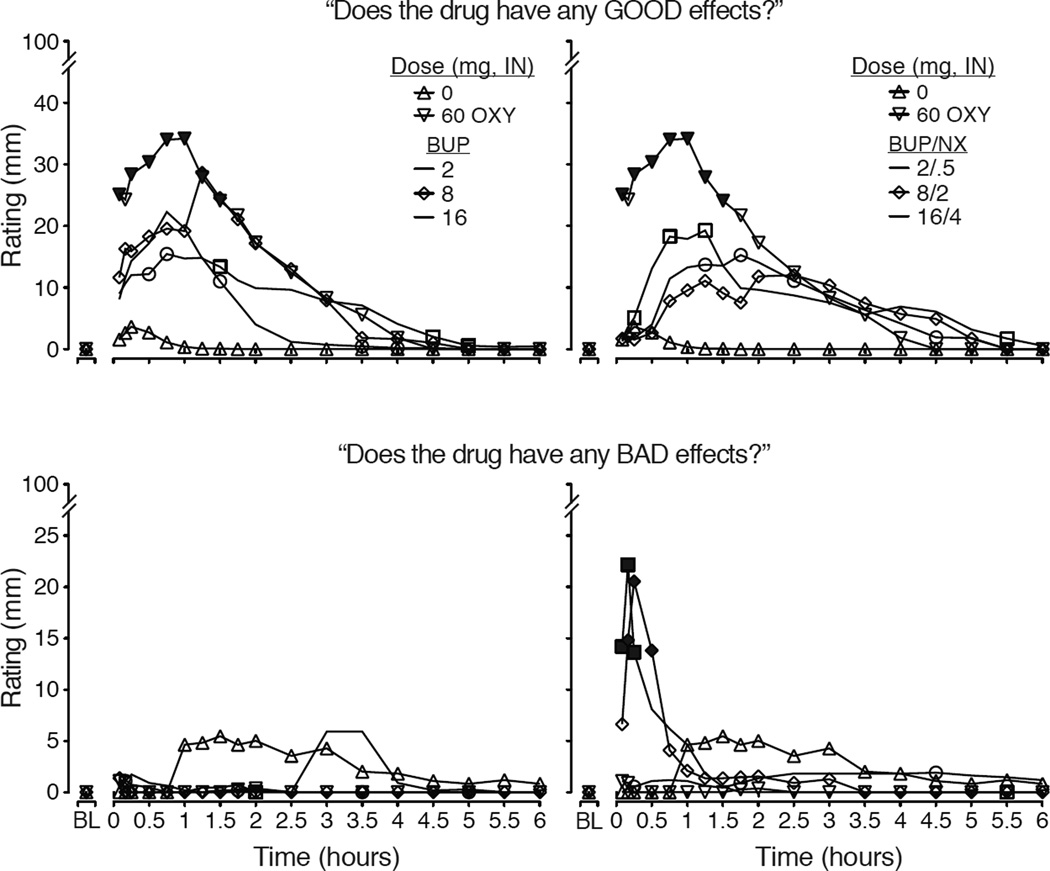
Figure 3.
Data shown depict the time-action curves for mean data (n=11; error bars omitted for clarity) collected during the 6.5 hour Sample sessions for two visual analog scales: Does the drug have any GOOD EFFECTS? (upper panels) and Does the drug have any BAD EFFECTS? (lower panels). On the left side, data are shown for the control conditions (placebo & 60 mg oxycodone) and the BUP doses while, on the right side, data are repeated for the control conditions and shown with the BUP/NX doses. For ratings of “good effects” there was a significant main effect of dose (F[7,70]=4.12; p=.001) and dose×time interaction (F[126, 160]=2.22; p<.0001). For ratings of bad effects, there was a significant main effect of dose (F=2.46; p=.026) and dose×time interaction (F=1.8; p<.0001). For both outcomes, there were significant main effects of time (p<.05). Filled symbols indicate significant differences between matched BUP vs. BUP/NX doses (e.g., 8 versus 8/2 at that time; Fisher’s LSD test; p<.05).

