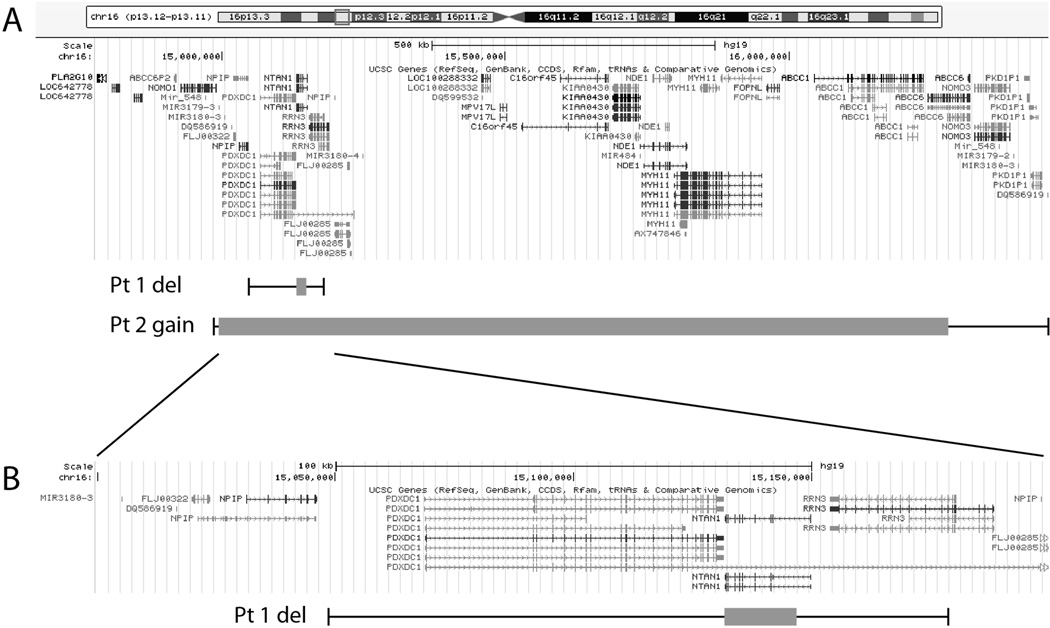
Figure 1.
Map of chromosome 16p13.11 illustrating locations of genes and extent of deleted and duplicated sequences in the region. (A) Ideogram of human chromosome 16 (above) and locations of transcripts for genes at 16p13.11 (middle) adapted from the UCSC Genome Browser (http://genome.ucsc.edu/) based on genome assembly GRCh37/hg19. Below are indicated the extent of deleted and duplicated sequences in patients 1 and 2 relative to positions of genes along the chromosome. Grey boxes encompass minimum regions of copy number variation and whiskers illustrate maximum potential areas of disruption. (B) Expanded view of the region deleted in patient 1 illustrating areas of minimum and maximum deleted sequences related to genes in the region.

