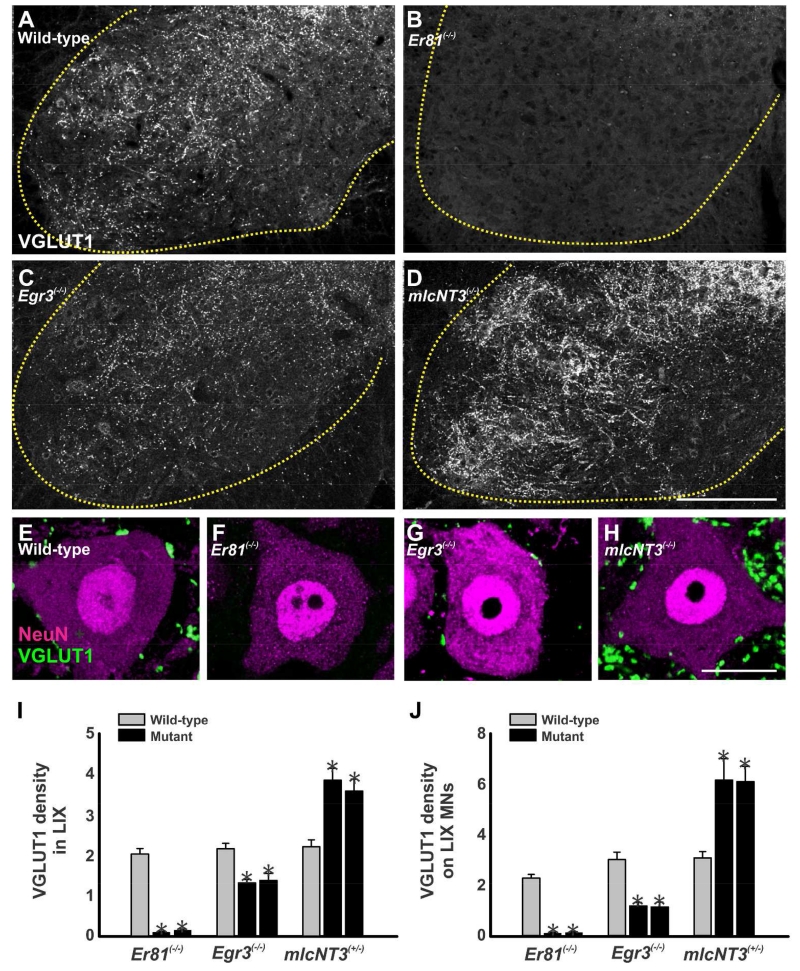
Figure 2. Distribution and density of VGLUT1-immunoreactive boutons in LIX and around motoneurons.
A-D, Low magnification confocal images of VGLUT1-immunoreactivity in the ventral horn of wild-type (A), Er81(−/−) (B), Egr3(−/−) (C) and mlcNT3(+/−) (D) animals at P20. The dotted yellow line indicates the border between the ventral grey and the white matter. At P20, VGLUT1-IR boutons are largely absent in the ventral horn of Er81(−/−) mice. Compared to wild-type animals, VGLUT1-immunoreactivity in the ventral horn appears decreased in Egr3(−/−) mice and increased in mlcNT3(+/−) animals. E-H, High magnification images of single confocal planes through the somata of NeuN-immunoreactive motoneurons (magenta, Cy3) and associated VGLUT1-IR boutons (green, FITC) in wild-type (E), Er81(−/−) (F), Egr3(−/−) (G) and mlcNT3(+/−) P20 animals (H). Virtually no VGLUT1-IR boutons were observed around motoneurons in Er81(−/−) mice and these were significantly decreased and of smaller size in Egr3(−/−) mice compared to wild-types. In contrast, the number of VGLUT1-IR varicosities in the neuropil and in contact with motoneurons was significantly increased in mlcNT3(+/−) animals. I, Lamina IX (LIX) neuropil density of VGLUT1-IR puncta (per 100 μm2) in mutant animals compared to wild-type littermates at P20. VGLUT1-IR clusters were nearly absent in the LIX neuropil of Er81(−/−) animals. In Egr3(−/−) animals VGLUT1-IR density was partially reduced, while mlcNT3(+/−) animals showed significant increases in density compared to wild-type littermates (asterisks, p<0.001, One-way ANOVA followed by Bonferroni-corrected t-tests). J, Number of VGLUT1-IR contacts per 100 μm of linear perimeter on NeuN-IR motoneuron somata at P20. Compared to wild-type littermates, VGLUT1-IR contacts on motoneurons were almost absent in Er81(−/−) animals (asterisks, p<0.001, Bonferroni-corrected t-tests) and significantly decreased in Egr3(−/−) mice (asterisk, p=0.015, Bonferroni-corrected t-tests). In contrast, VGLUT1-IR contact density increased in both mlcNT3(+/−) mice compared to wild-type littermates at P20 (asterisks, p<0.001, Bonferroni-corrected t-tests). In all the graphs the error bars represent SEM estimates. Scale bars: 200 μm in D (A to D at the same magnification); 10 μm in E (E to G at the same magnification); 20 μm in H.

