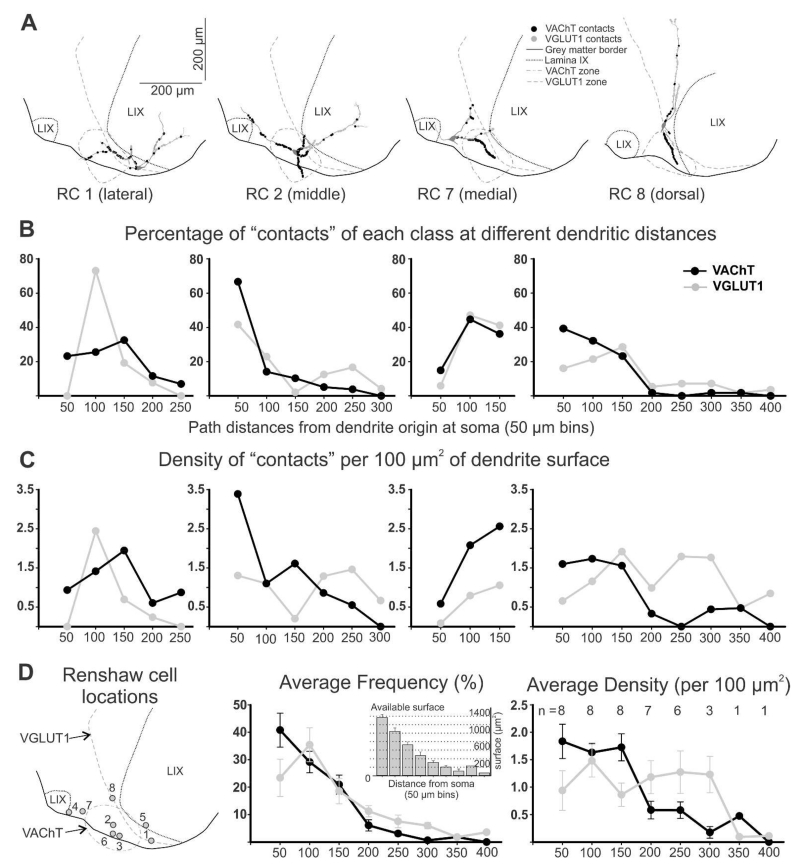
Figure 5. Quantification of VGLUT1-IR and VAChT-IR contacts on reconstructed Renshaw cells.
A, Four reconstructed RCs, three with cell bodies located lateral (RC 1), medial (RC 7) or dorsal (RC 8) to the region containing a high density of VAChT-IR boutons and one RC with the cell body in the middle of this region (RC 2). The positions of VAChT-IR contacts are marked in black and VGLUT1 contacts in grey. The highest numbers of contacts occur in dendrite segments entering the VAChT and VGLUT1 areas, independent of distance to cell body, order of dendrite or thickness. B, Distribution of contacts along the dendrites of the four cells shown in A. Y-axis is the percentage of contacts of each class (i.e., percentage of VAChT-IR contacts in each bin with respect to all VAChT contacts), found at different distance bins. X-axis represents path distance; “50” means contacts from 0 (dendrite origins) to 50 μm path distance (in any dendrite), “100” is for contacts located >50 to 100, and so on. Cells located medial, lateral and dorsal to the VAChT regions have variable distributions of VAChT contacts because differences in dendrite locations. Dendrites entering the VAChT region receive a large number of contacts, while dendrites away from this region receive very few. In contrast, RCs with cell bodies in the middle of the VAChT region (i.e., RC 2) display balanced distributions of high numbers of VAChT-IR contacts in all proximal dendrites that then decay with distance. In general, few VAChT-IR contacts are found further than 150 μm from the cell body. VGLUT1-IR contacts are also found in higher frequency in dendrite regions entering the area with high density of VGLUT1-IR boutons. By difference to VAChT-IR contacts they are also frequent in distal dendrites. C, Density of VAChT-IR and VGLUT1-IR contacts (boutons per 100 μm2 of dendrite surface) at different distance bins in the same four cells. D, Average frequency and density of contacts for the eight RCs reconstructed. In the left panel the location of all RCs are indicated on an “average” section profile with the approximate VGLUT1 and VAChT areas indicated. Middle panel represents the average distribution of VAChT- and VGLUT1-IR contacts at different distance bins in the eight RCs (error bars indicate SEMs; not all RCs had dendrite segments at all distances and the number of RCs included in each data point is indicated in the right panel). VAChT-IR contacts decrease in frequency more abruptly than VGLUT1-IR contacts. The distribution of available surface at different distances in indicated in the inset histogram. As a result, on average, the density of VAChT-IR contacts falls abruptly after 150 μm distance from the cell body, while the density of VGLUT1-IR contacts is maintained in the distal dendrite. The largest overlap between VAChT-IR and VGLUT1-IR contacts occurs in the first 100 μm of dendrites.

